

Path visualisation
Slow on the path? See whose network it is.
A traceroute lists the routers between two points, and each router is a hop. FishEye traces each target from its probes on the schedule you set, as often as once a minute. It shows every hop with its loss, its round trip, the network that runs it and where it is, and keeps 90 days of traces so you can see what the route looked like before.
Path visualisation is included from plan T2.
Read the path hop by hop. See where the delay starts.
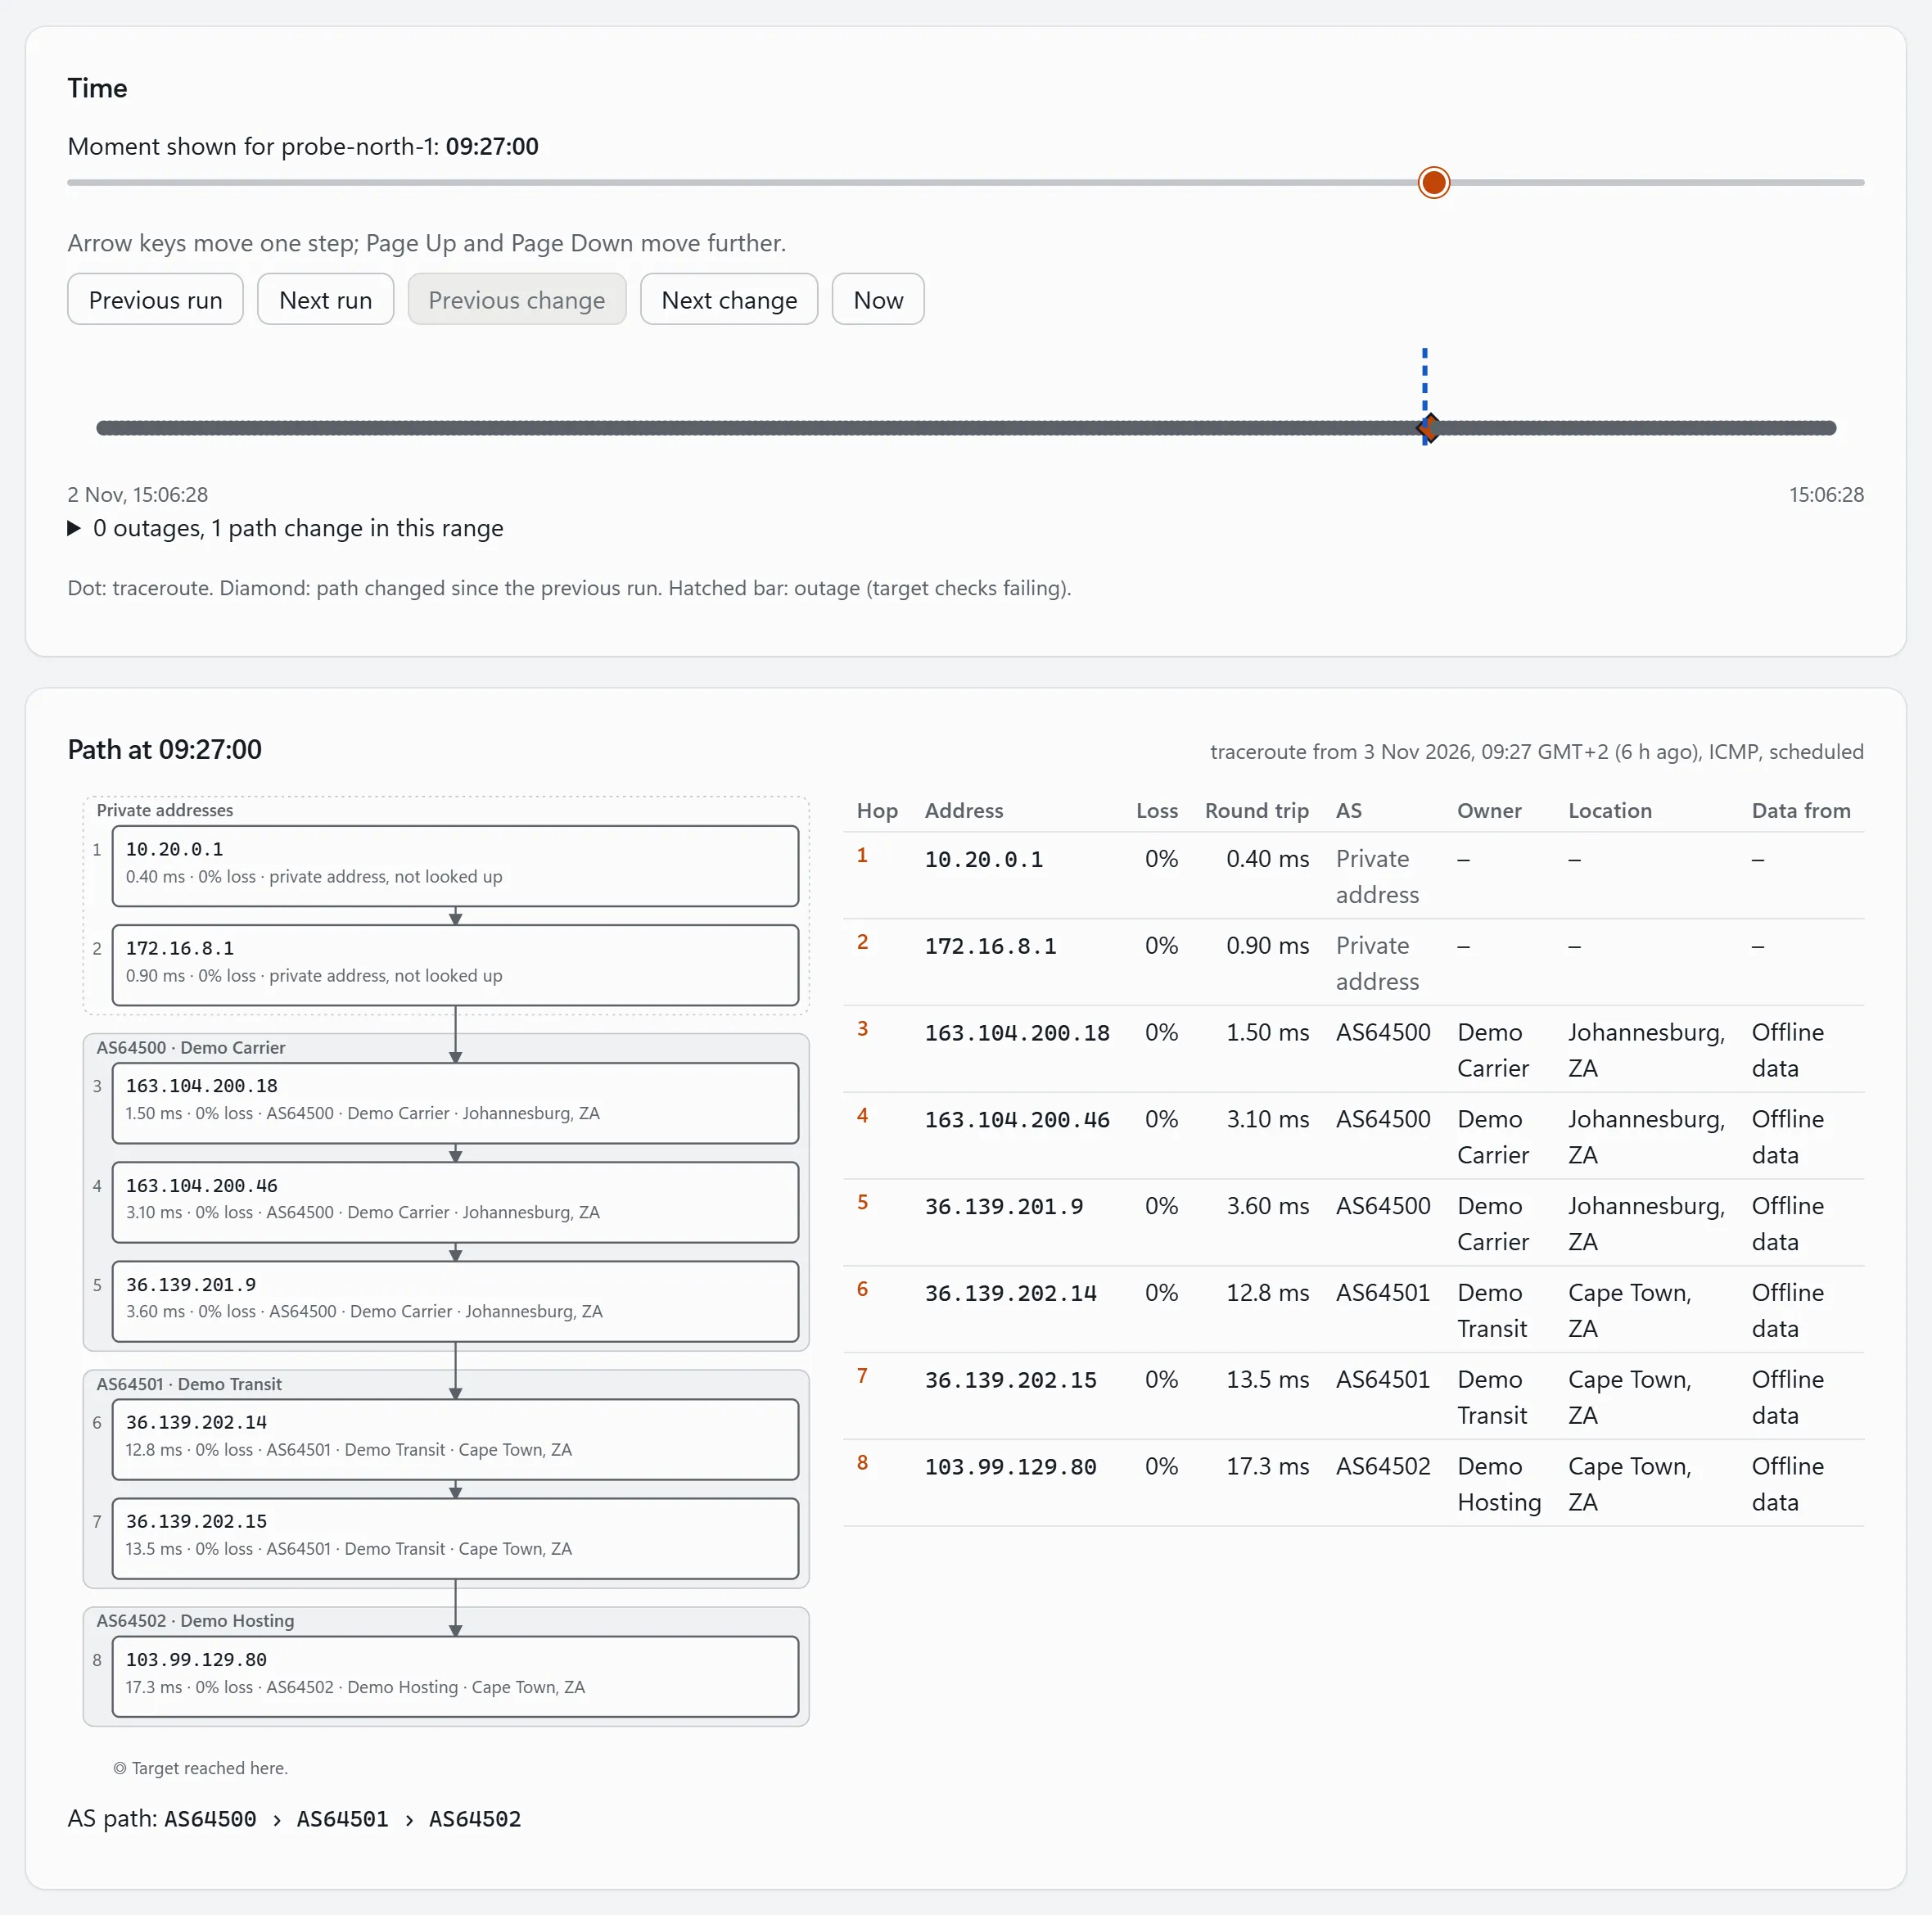
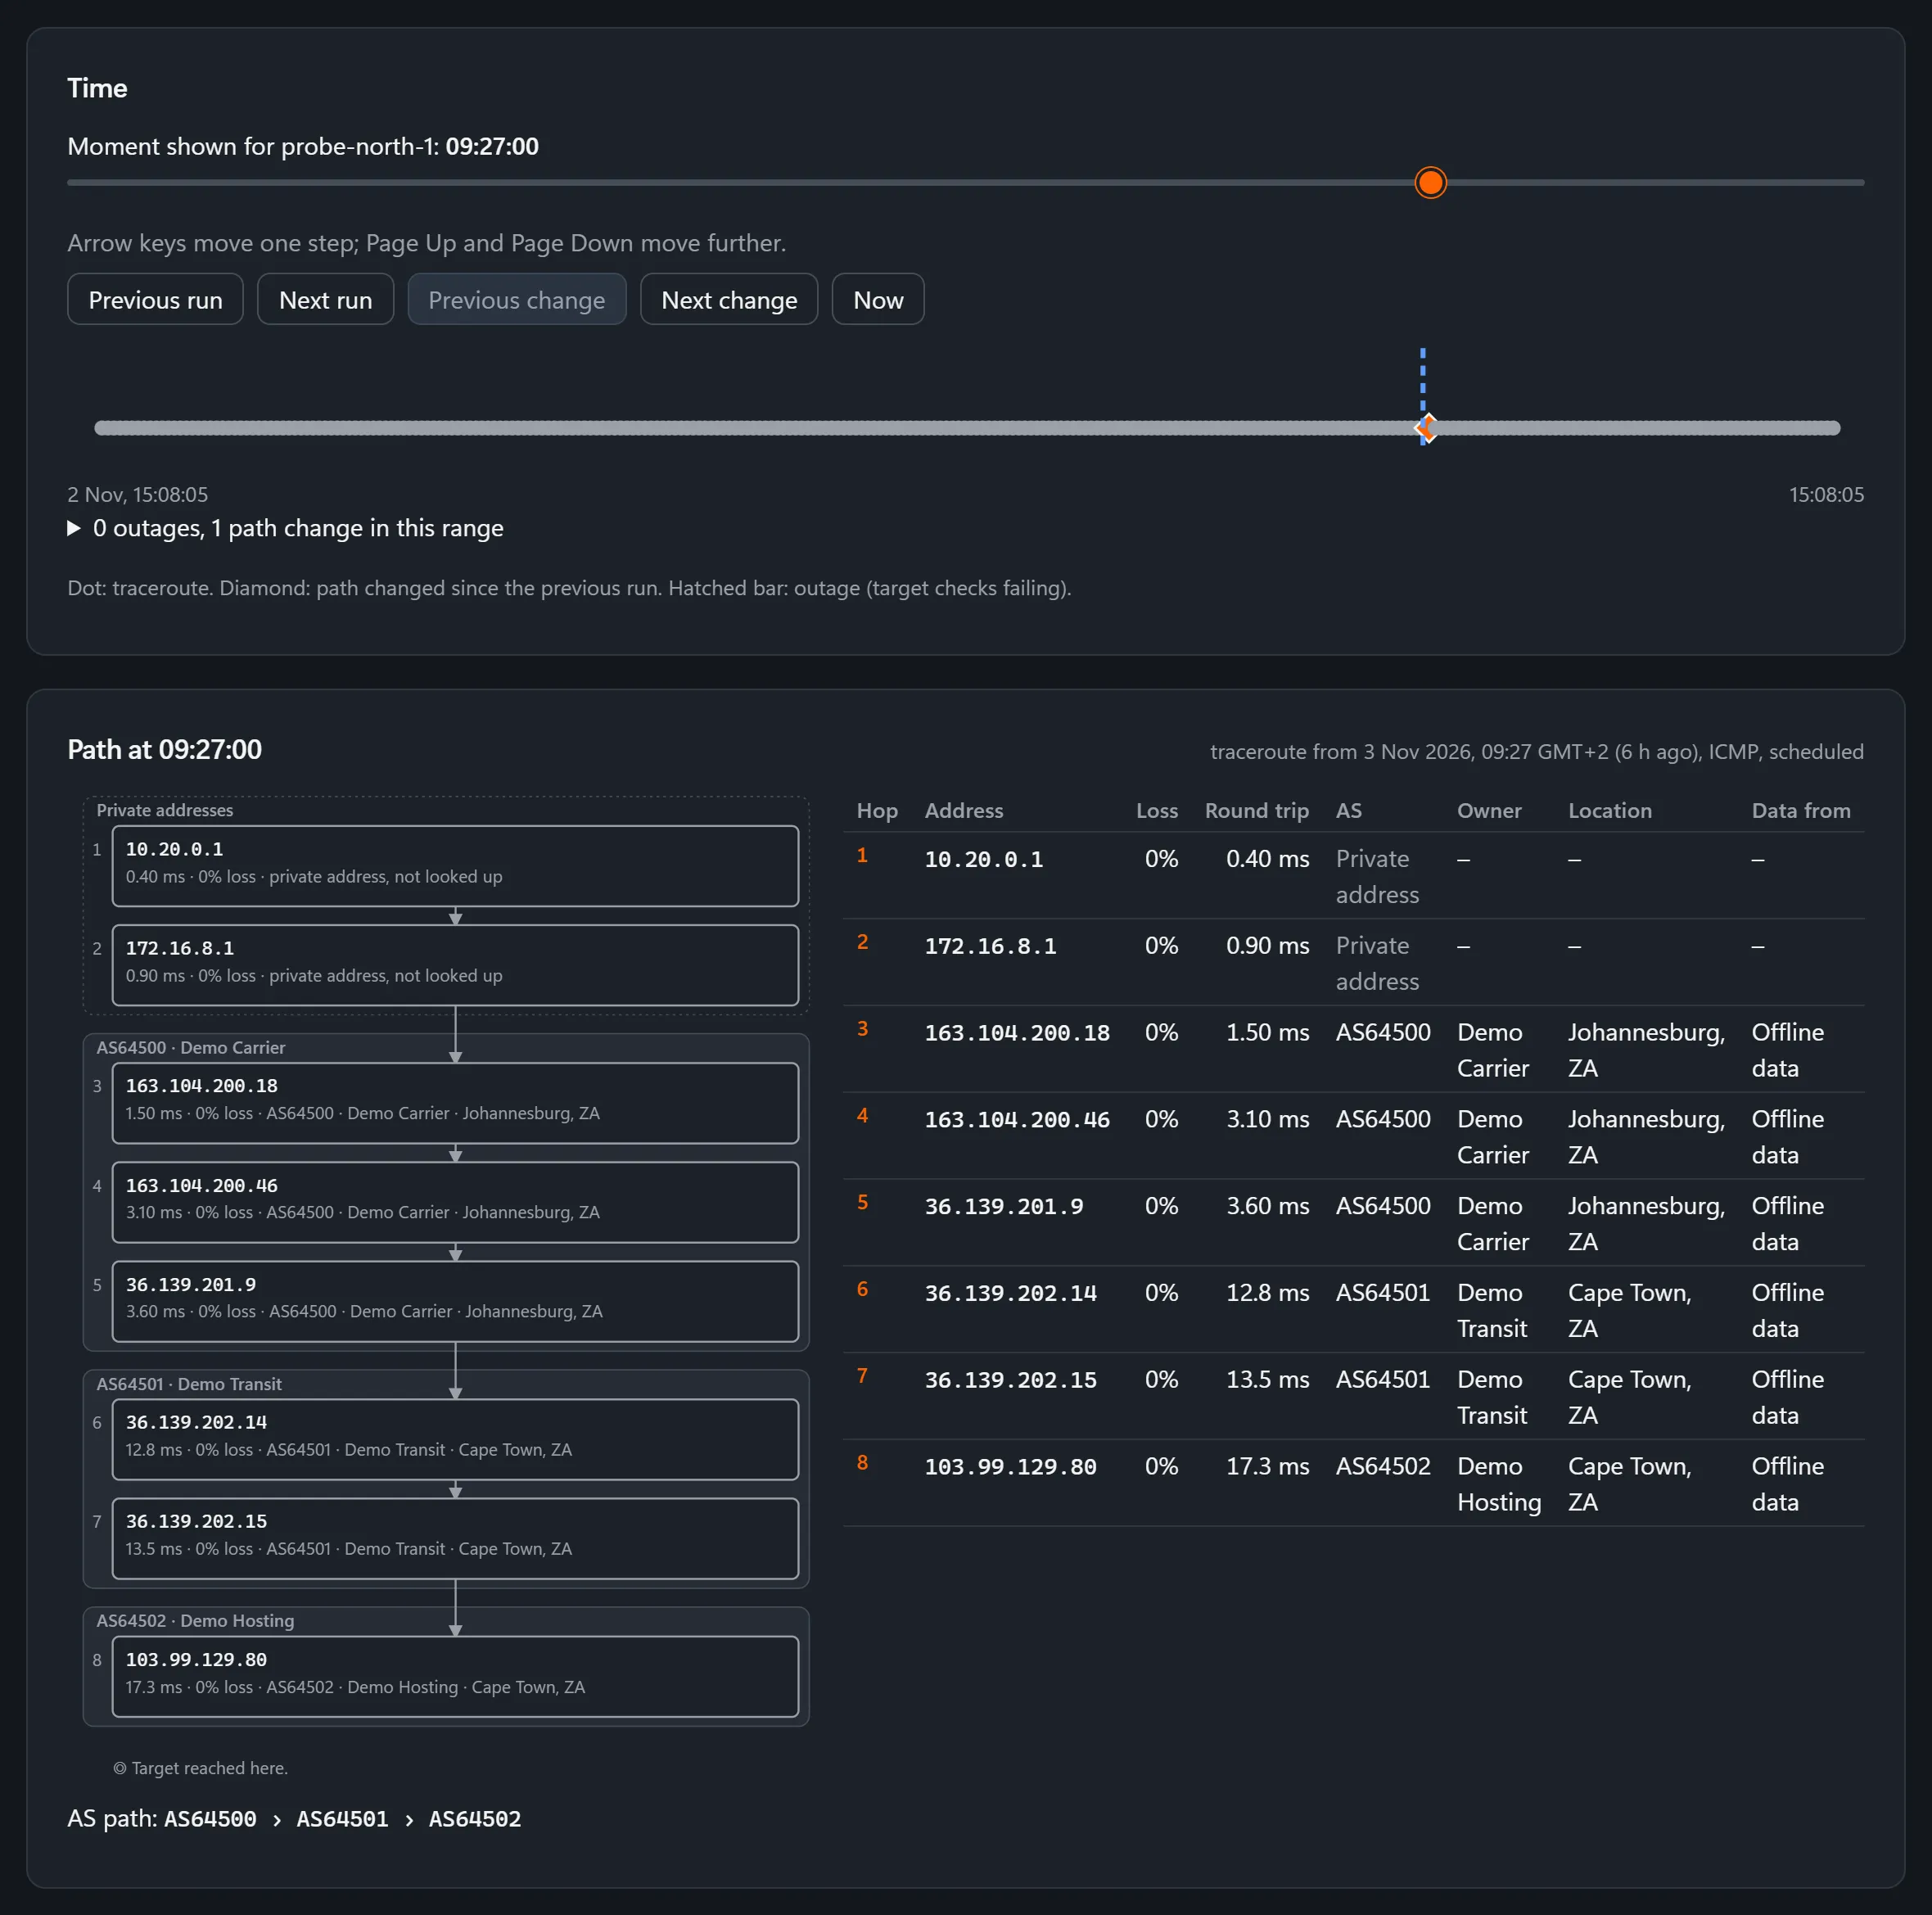
The path page draws the route from a probe to the target and lists every hop beside it: its address, its loss, its round trip, its network and its place. Where the round trip jumps and stays up for every hop after it, that is the link to ask about.
- Each hop shows every router that answered at that step, so traffic spread over several routers reads as one hop, not a mess.
- A hop that does not answer shows as no answer; it says nothing about the route.
- Under the table, the path as a list of networks (the AS path) shows whose networks the traffic crosses, in order.
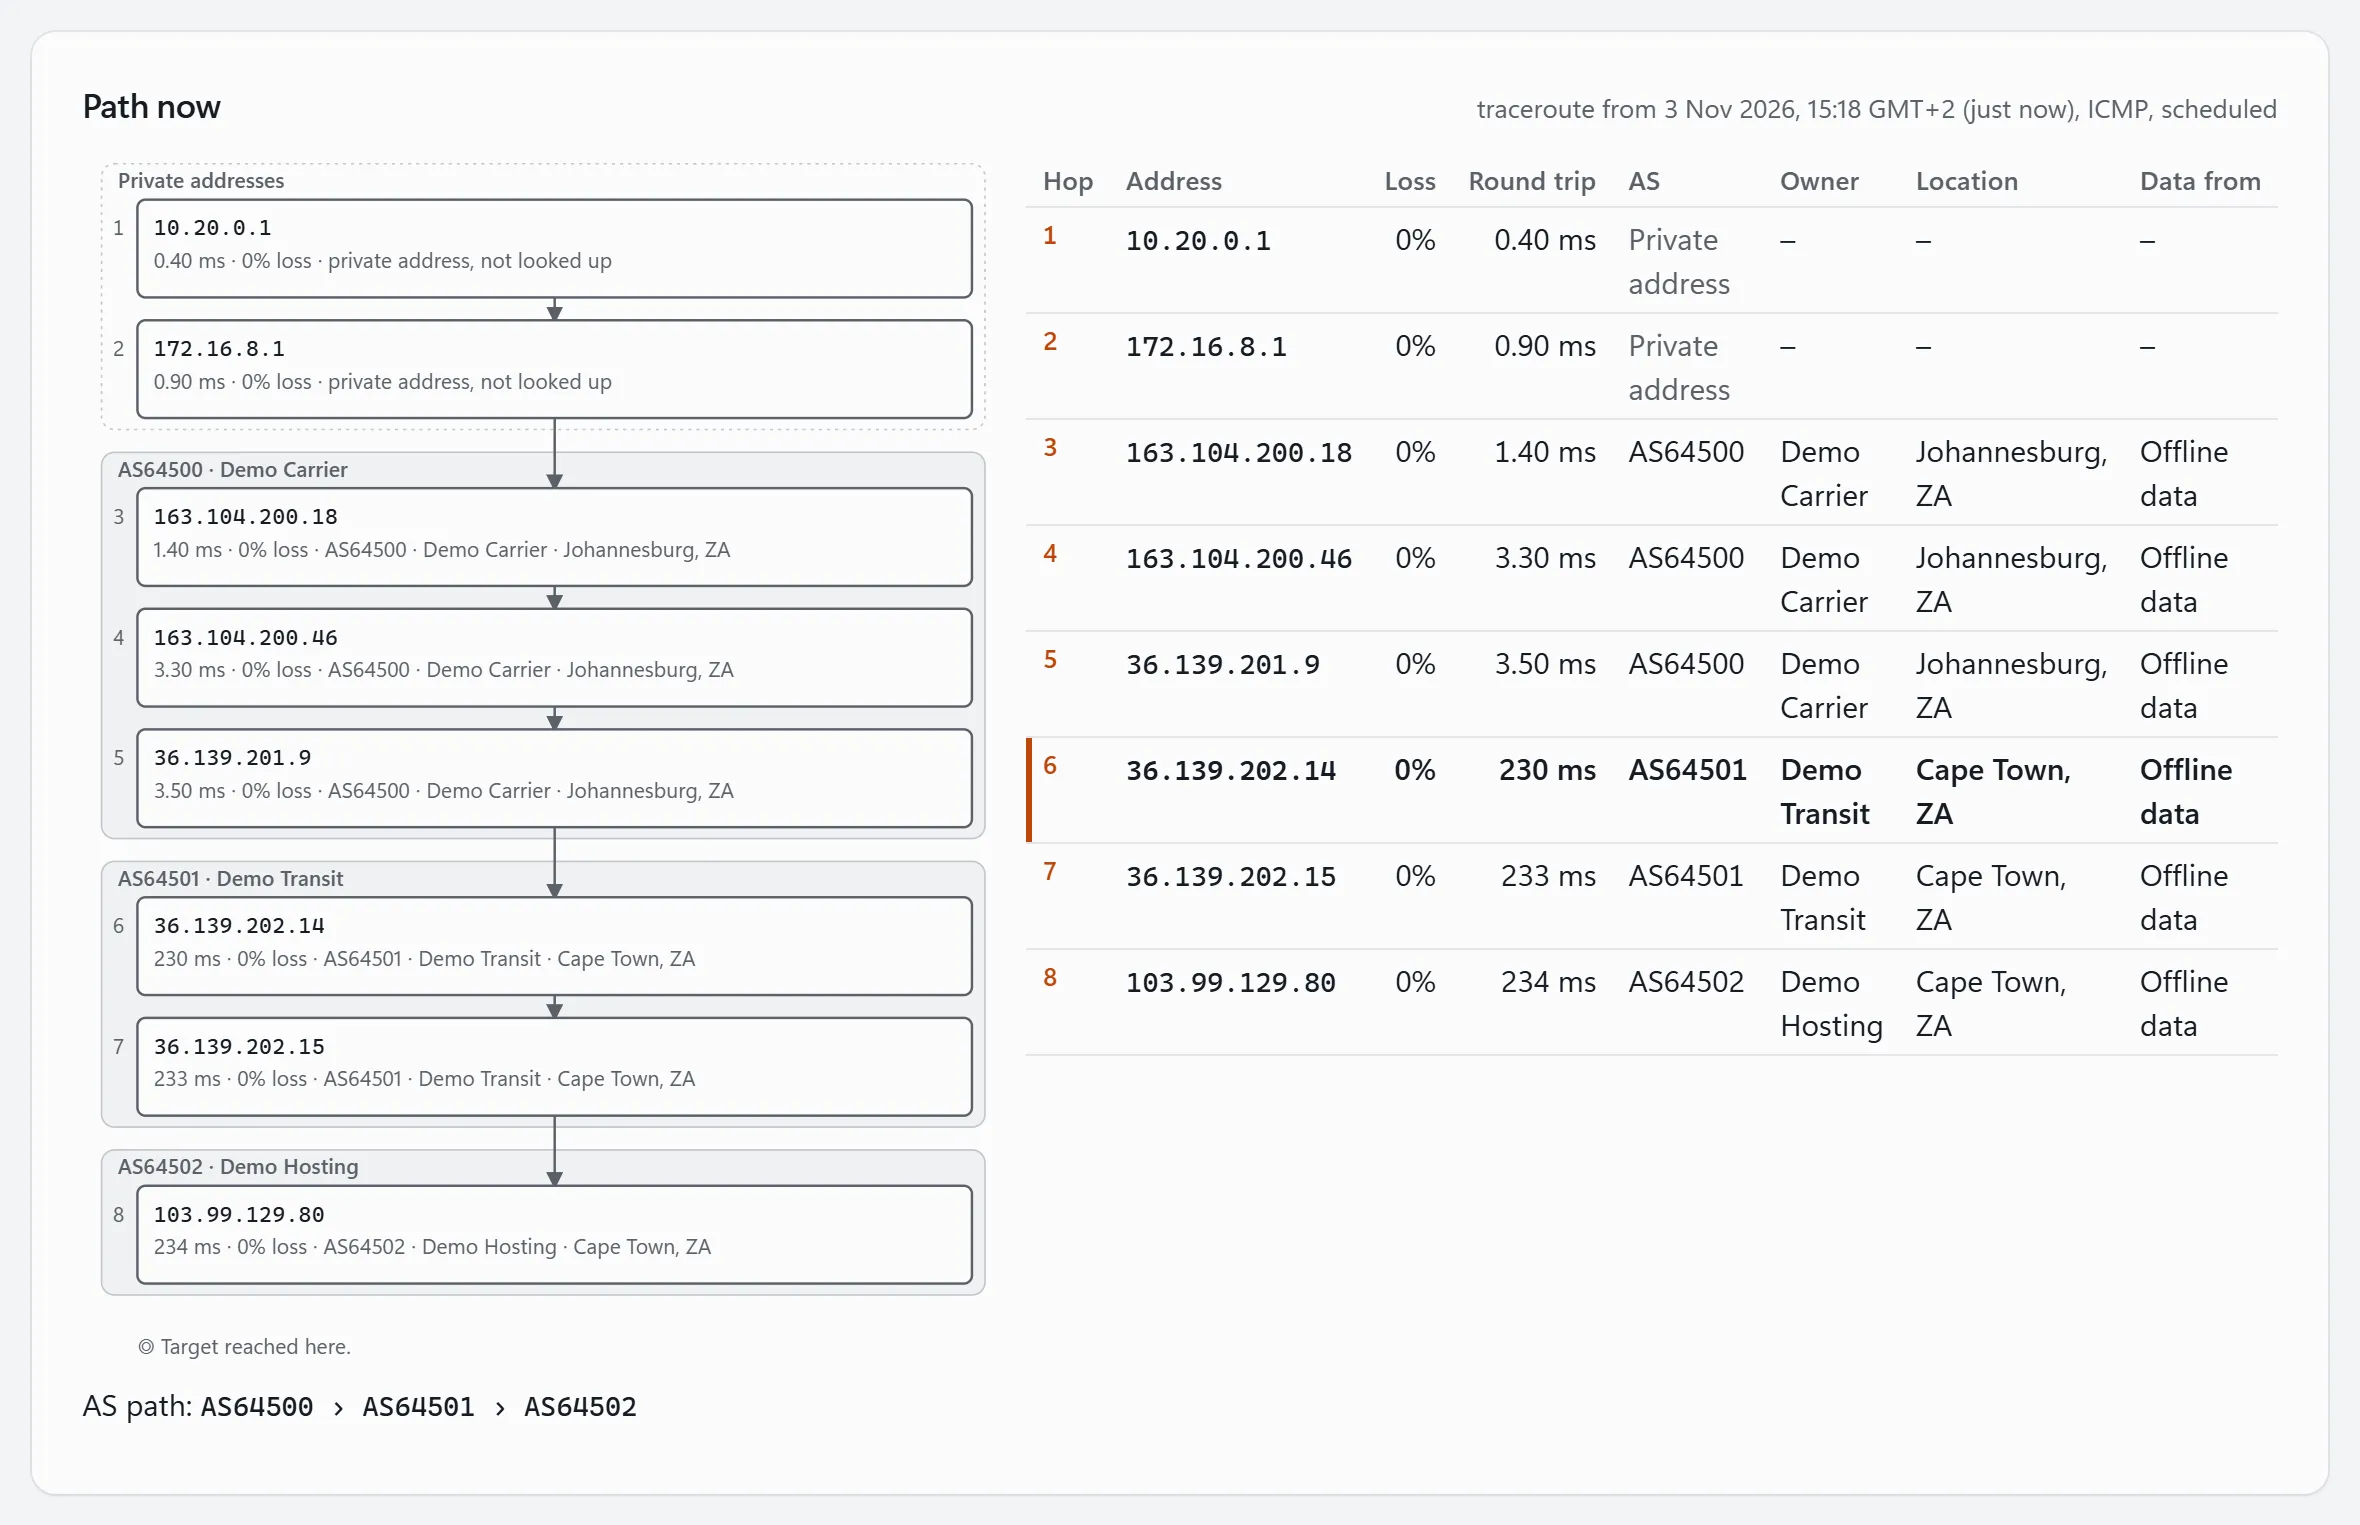
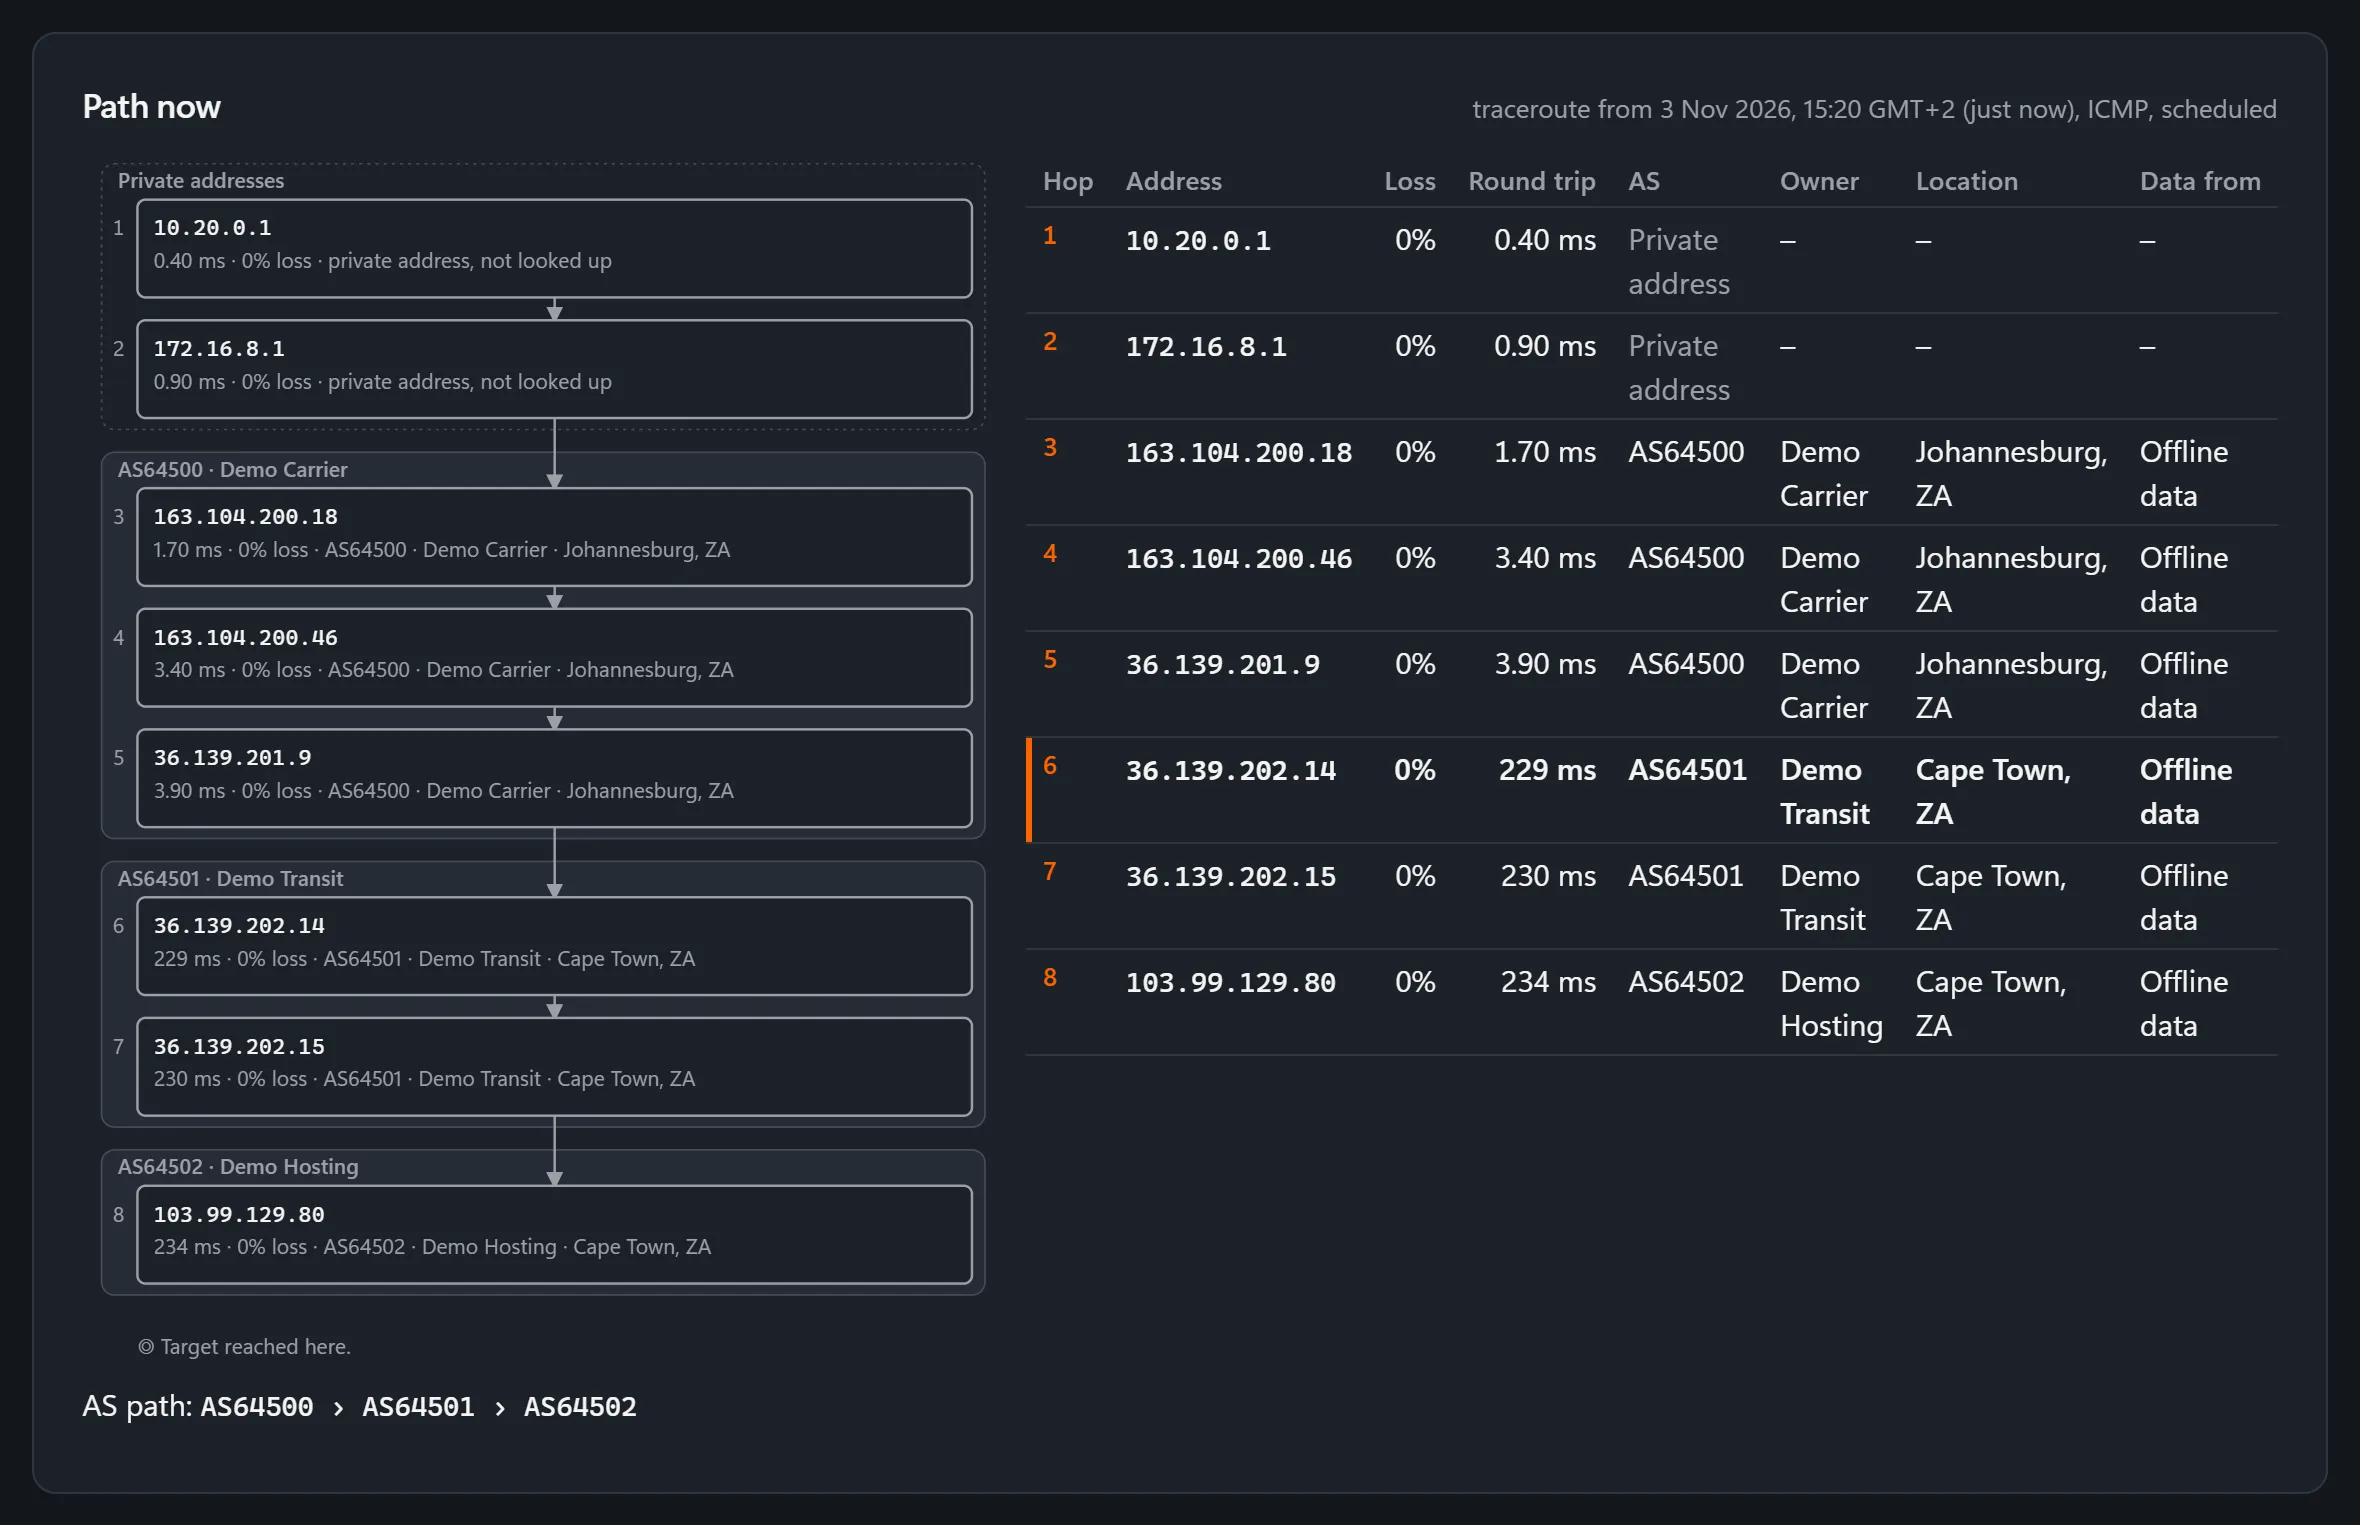
Every hop has a network and a place.
Each hop shows the network that runs it, then where it is. A network is named by its AS number, the number it is known by on the internet, beside its owner. A Data from column says where each answer came from.
- FishEye asks, in order: a table of networks and countries you import yourself, then your own routers’ BGP table if you stream it to FishEye, then the public RIPEstat service for what is still missing.
- The RIPEstat lookups are two switches under Settings, Outbound calls. Turn them off, or answer yes to air-gapped at install, and nothing is sent.
- Private, shared carrier (CGNAT) and documentation addresses are never looked up. They show as private address.
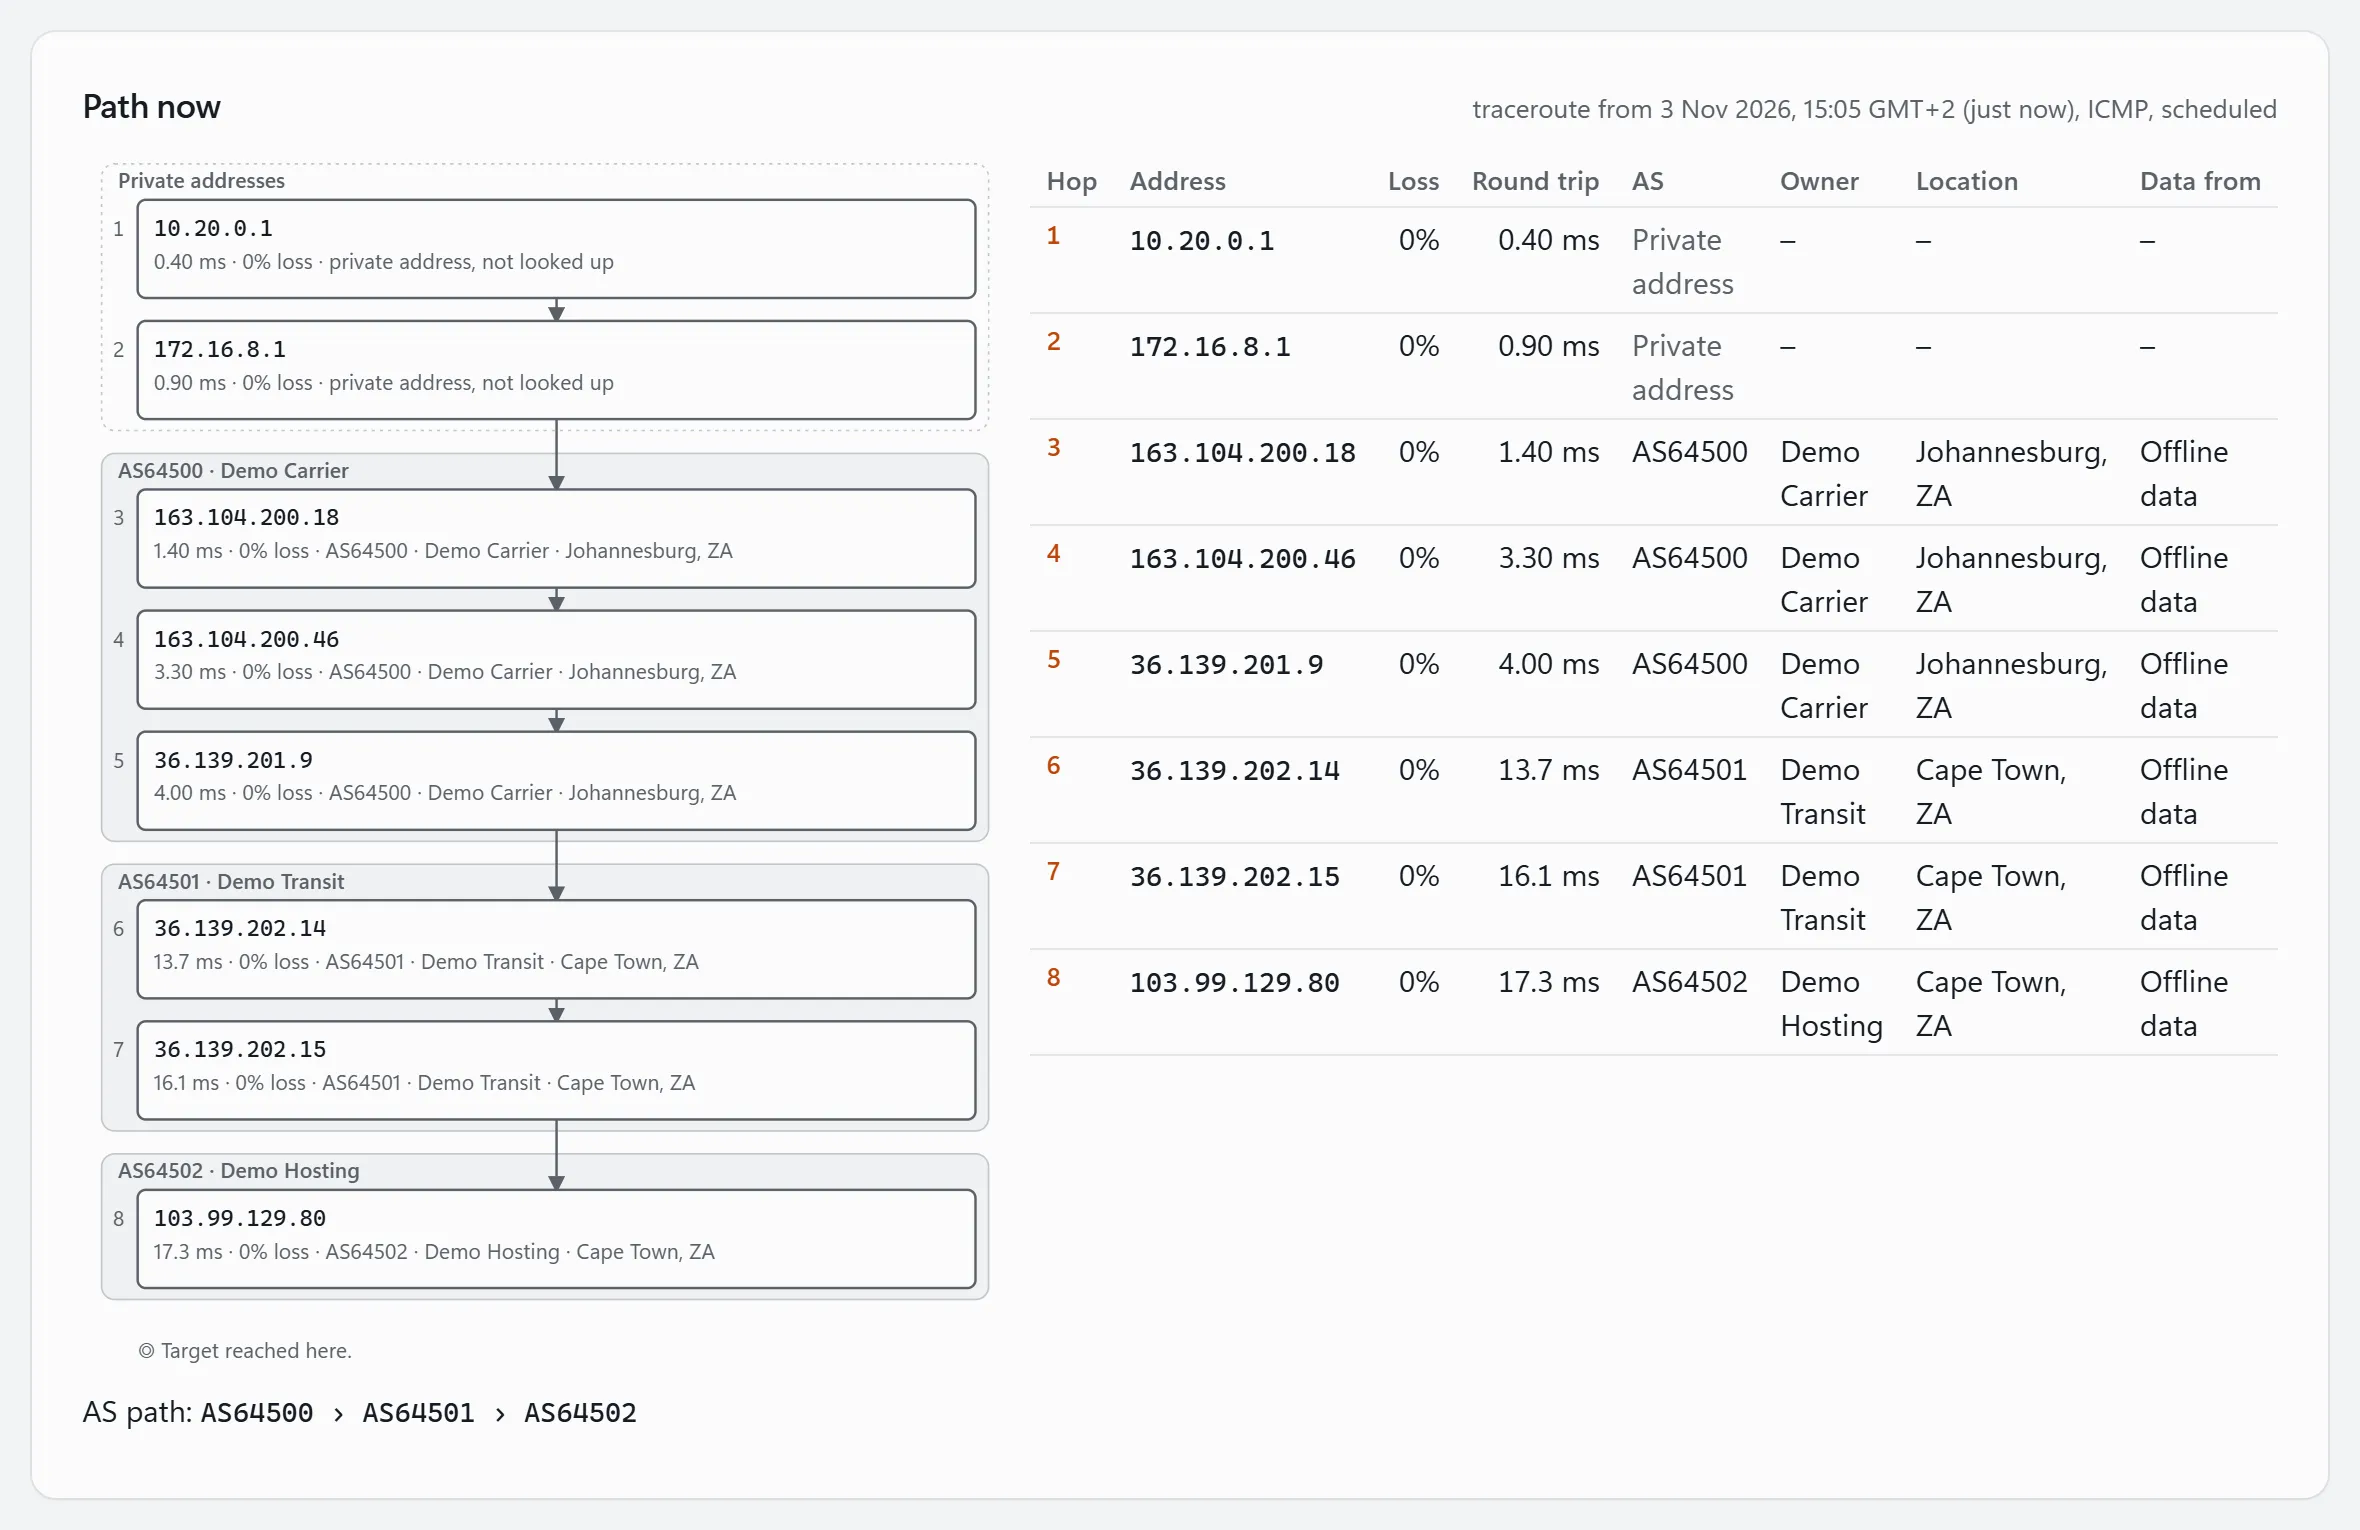
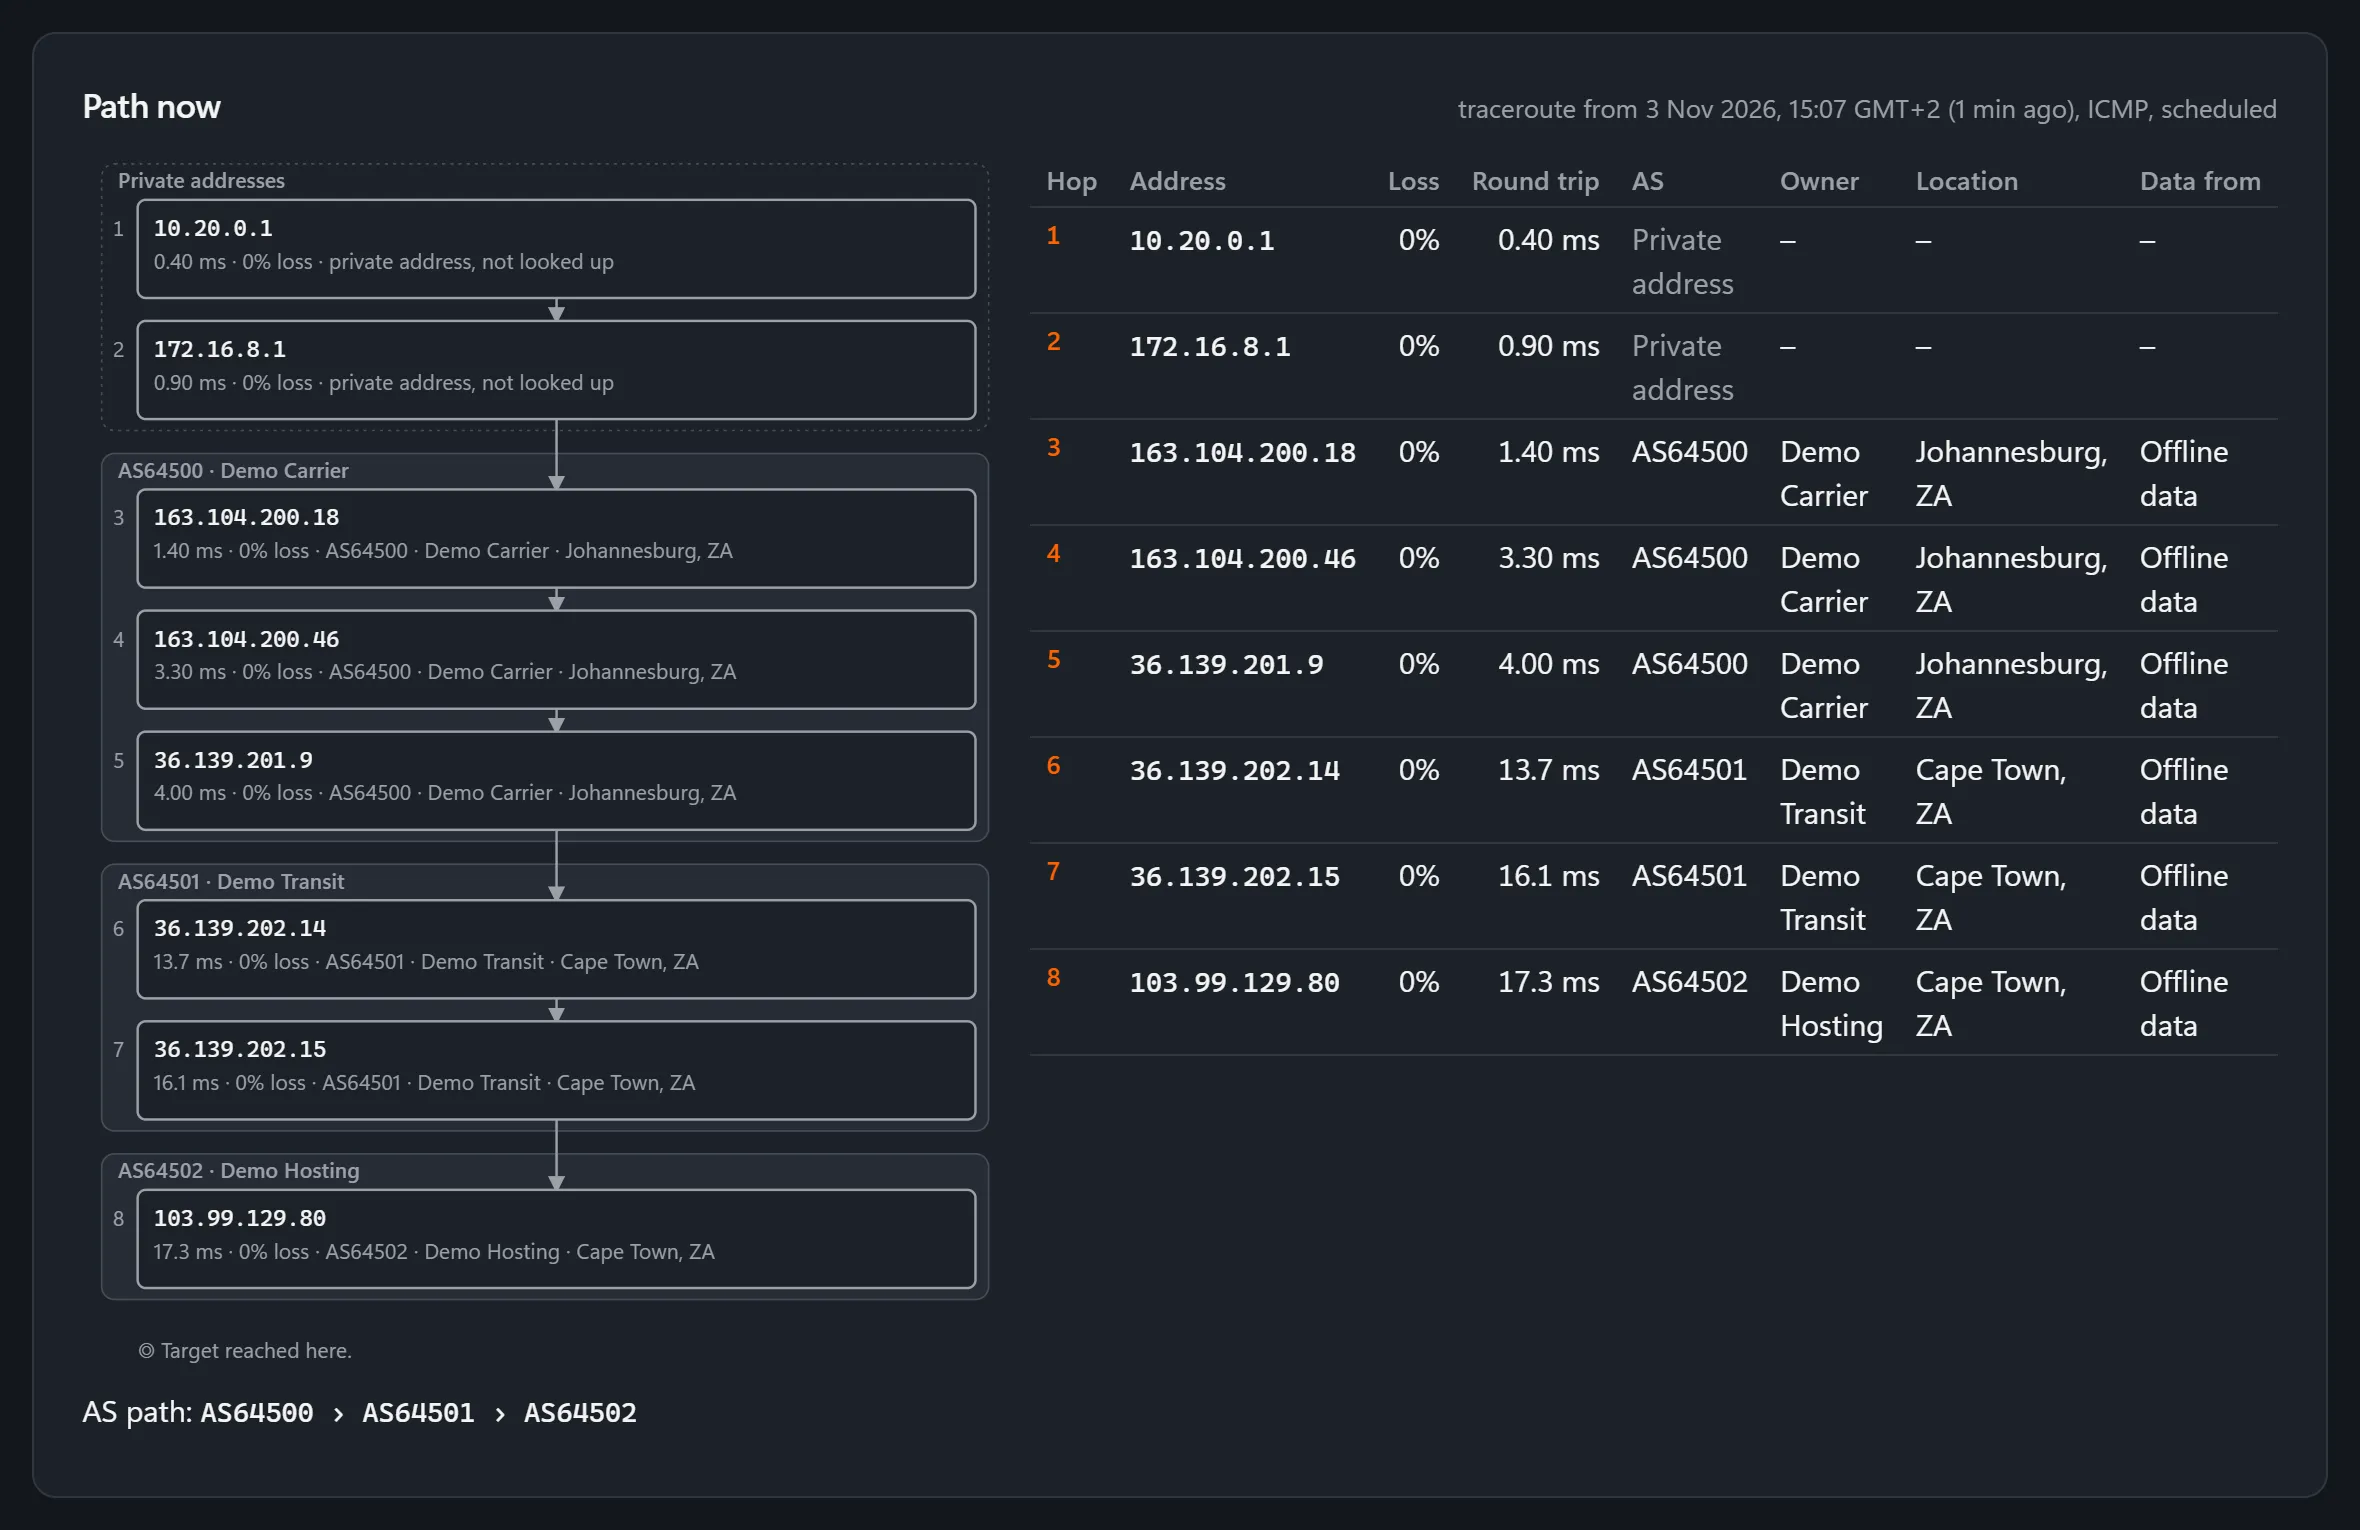
Scroll back to the route before.
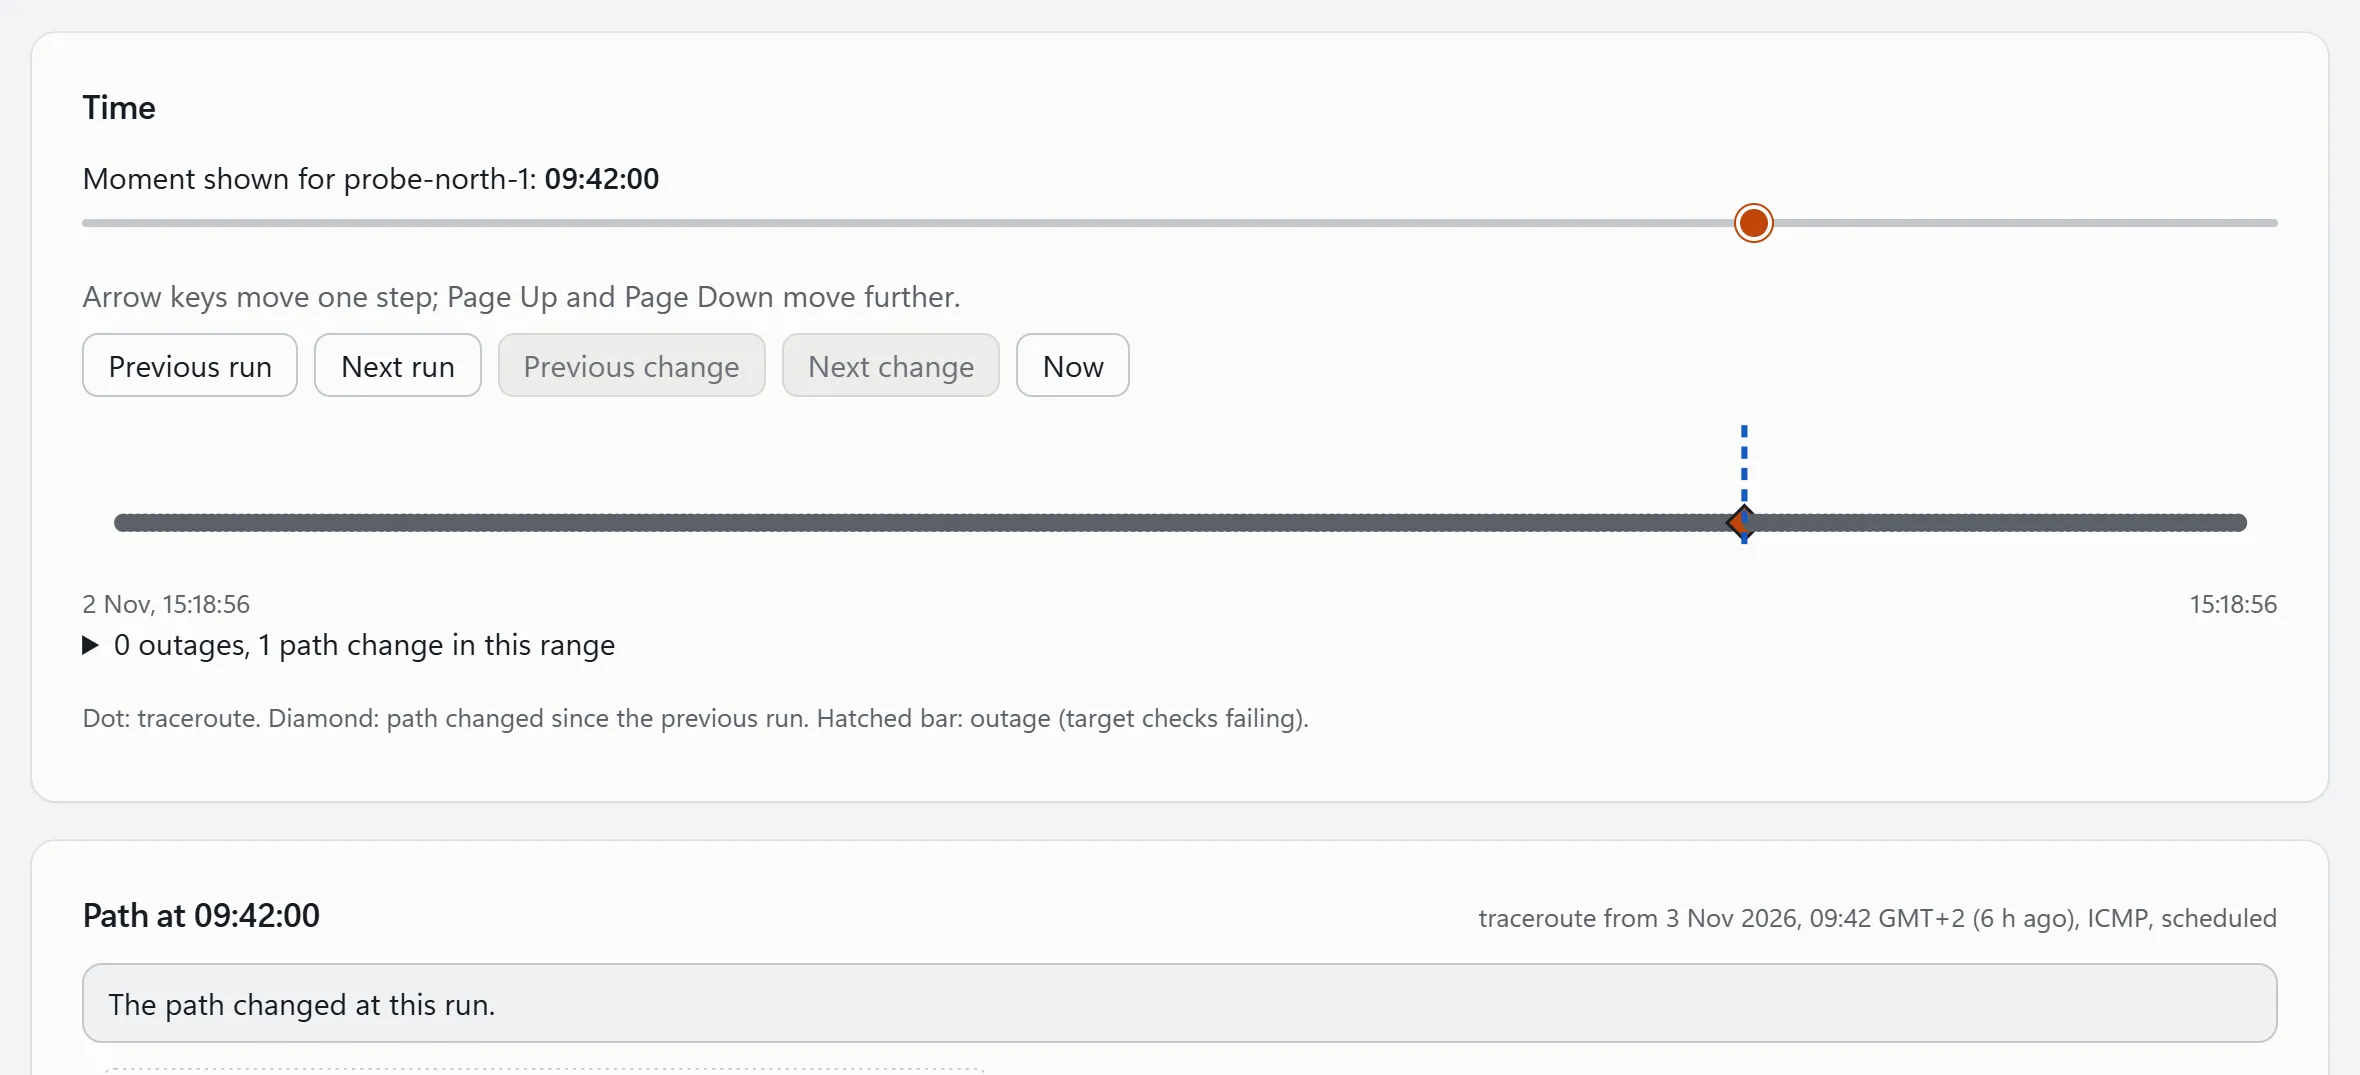
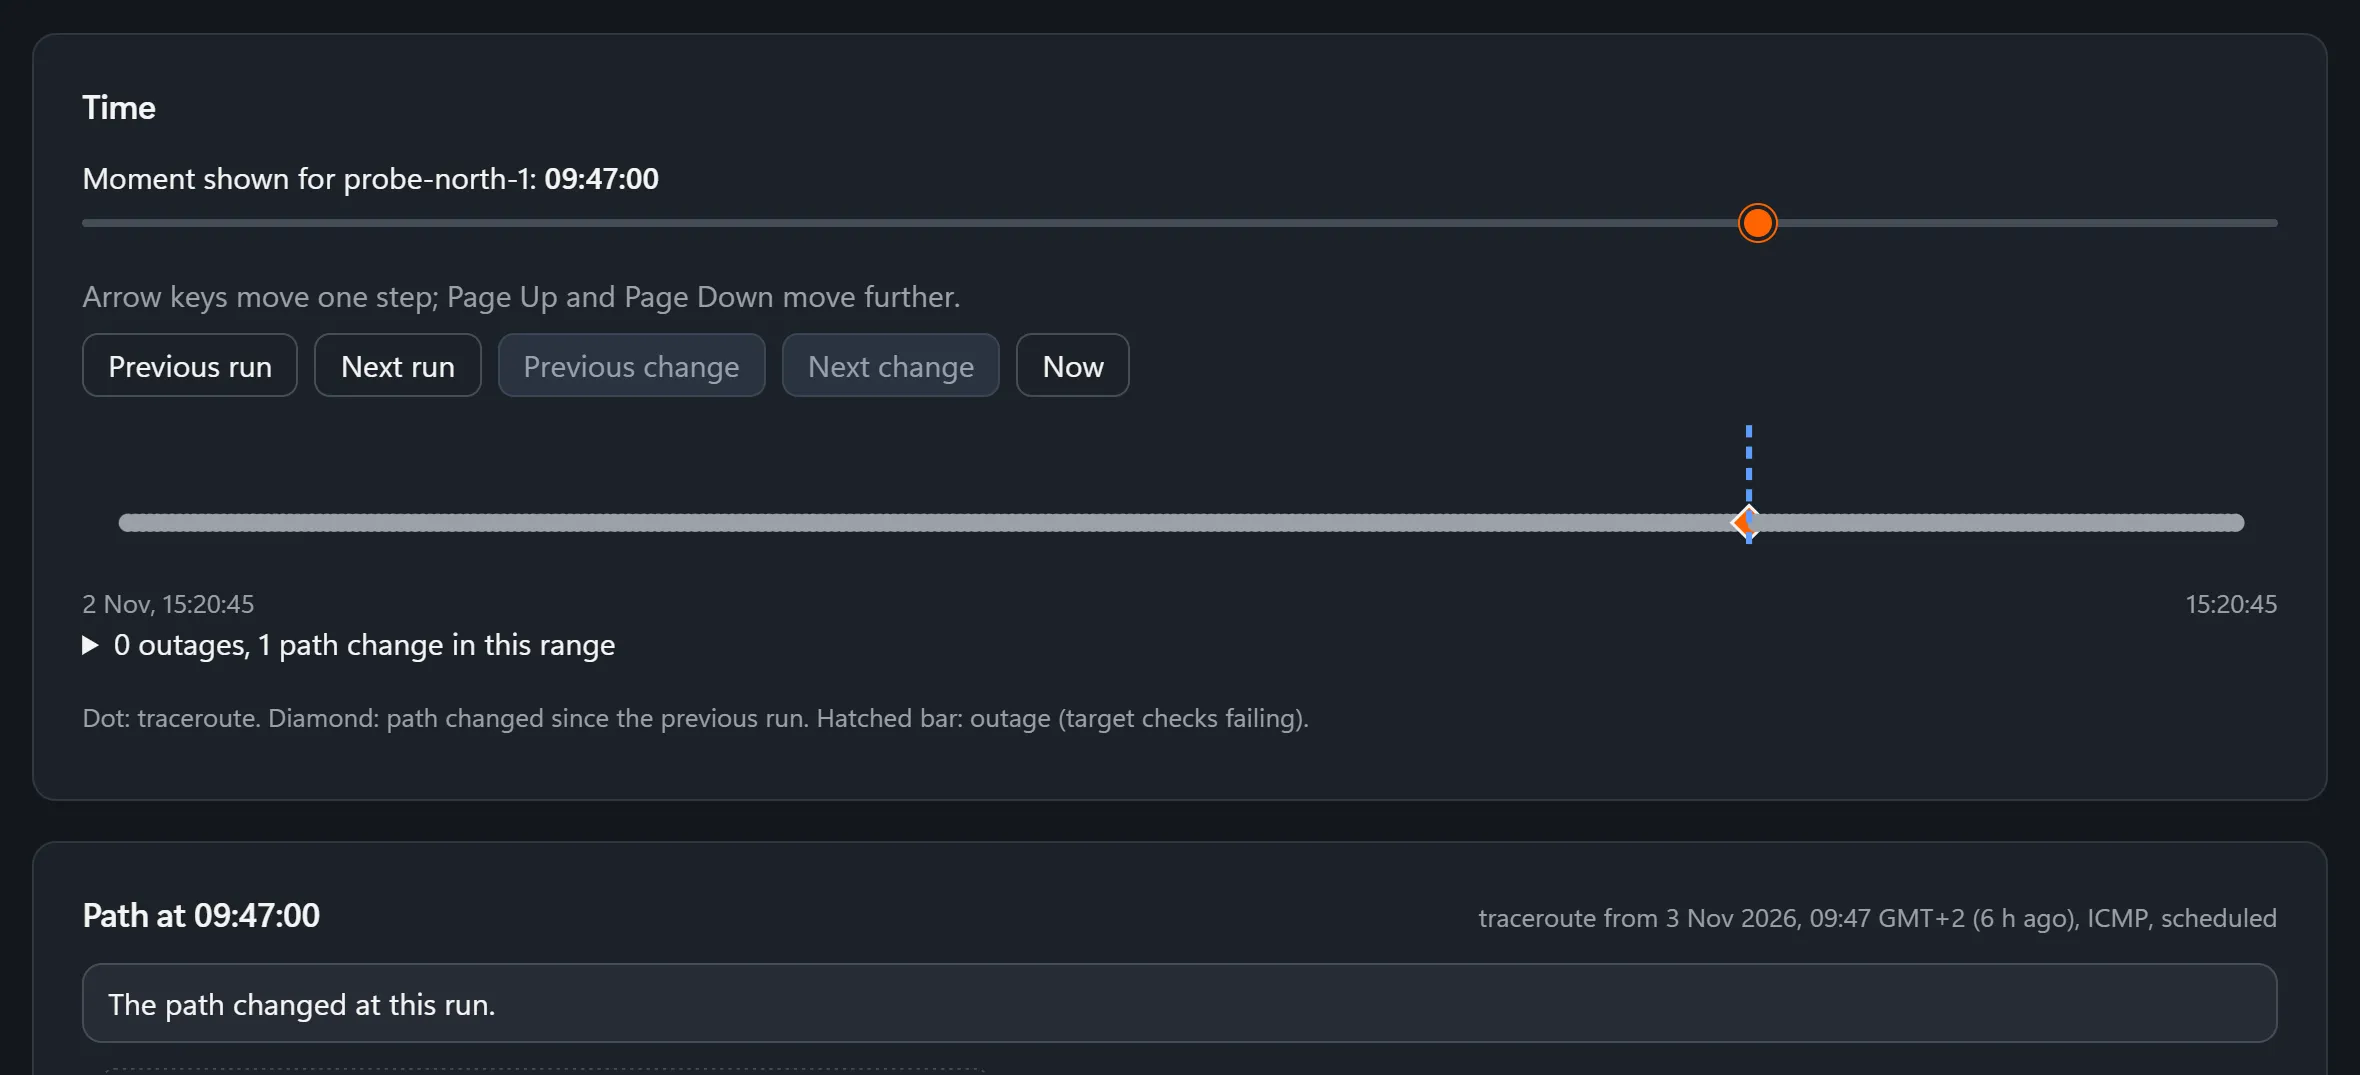
The time slider above the path sets the moment shown. Drag it, or use the arrow keys, and the diagram and the hop table show the trace from that moment. Go back to live with one click.
- Every trace is a dot on the slider. A diamond marks a trace whose path differs from the one before it.
- Times when the target’s checks were failing are hatched on the slider and listed under it with their start and end.
- Switch between the vantage points that traced the target: each probe, the server, and agents on users’ computers. Each keeps its own history.
One hop over time.
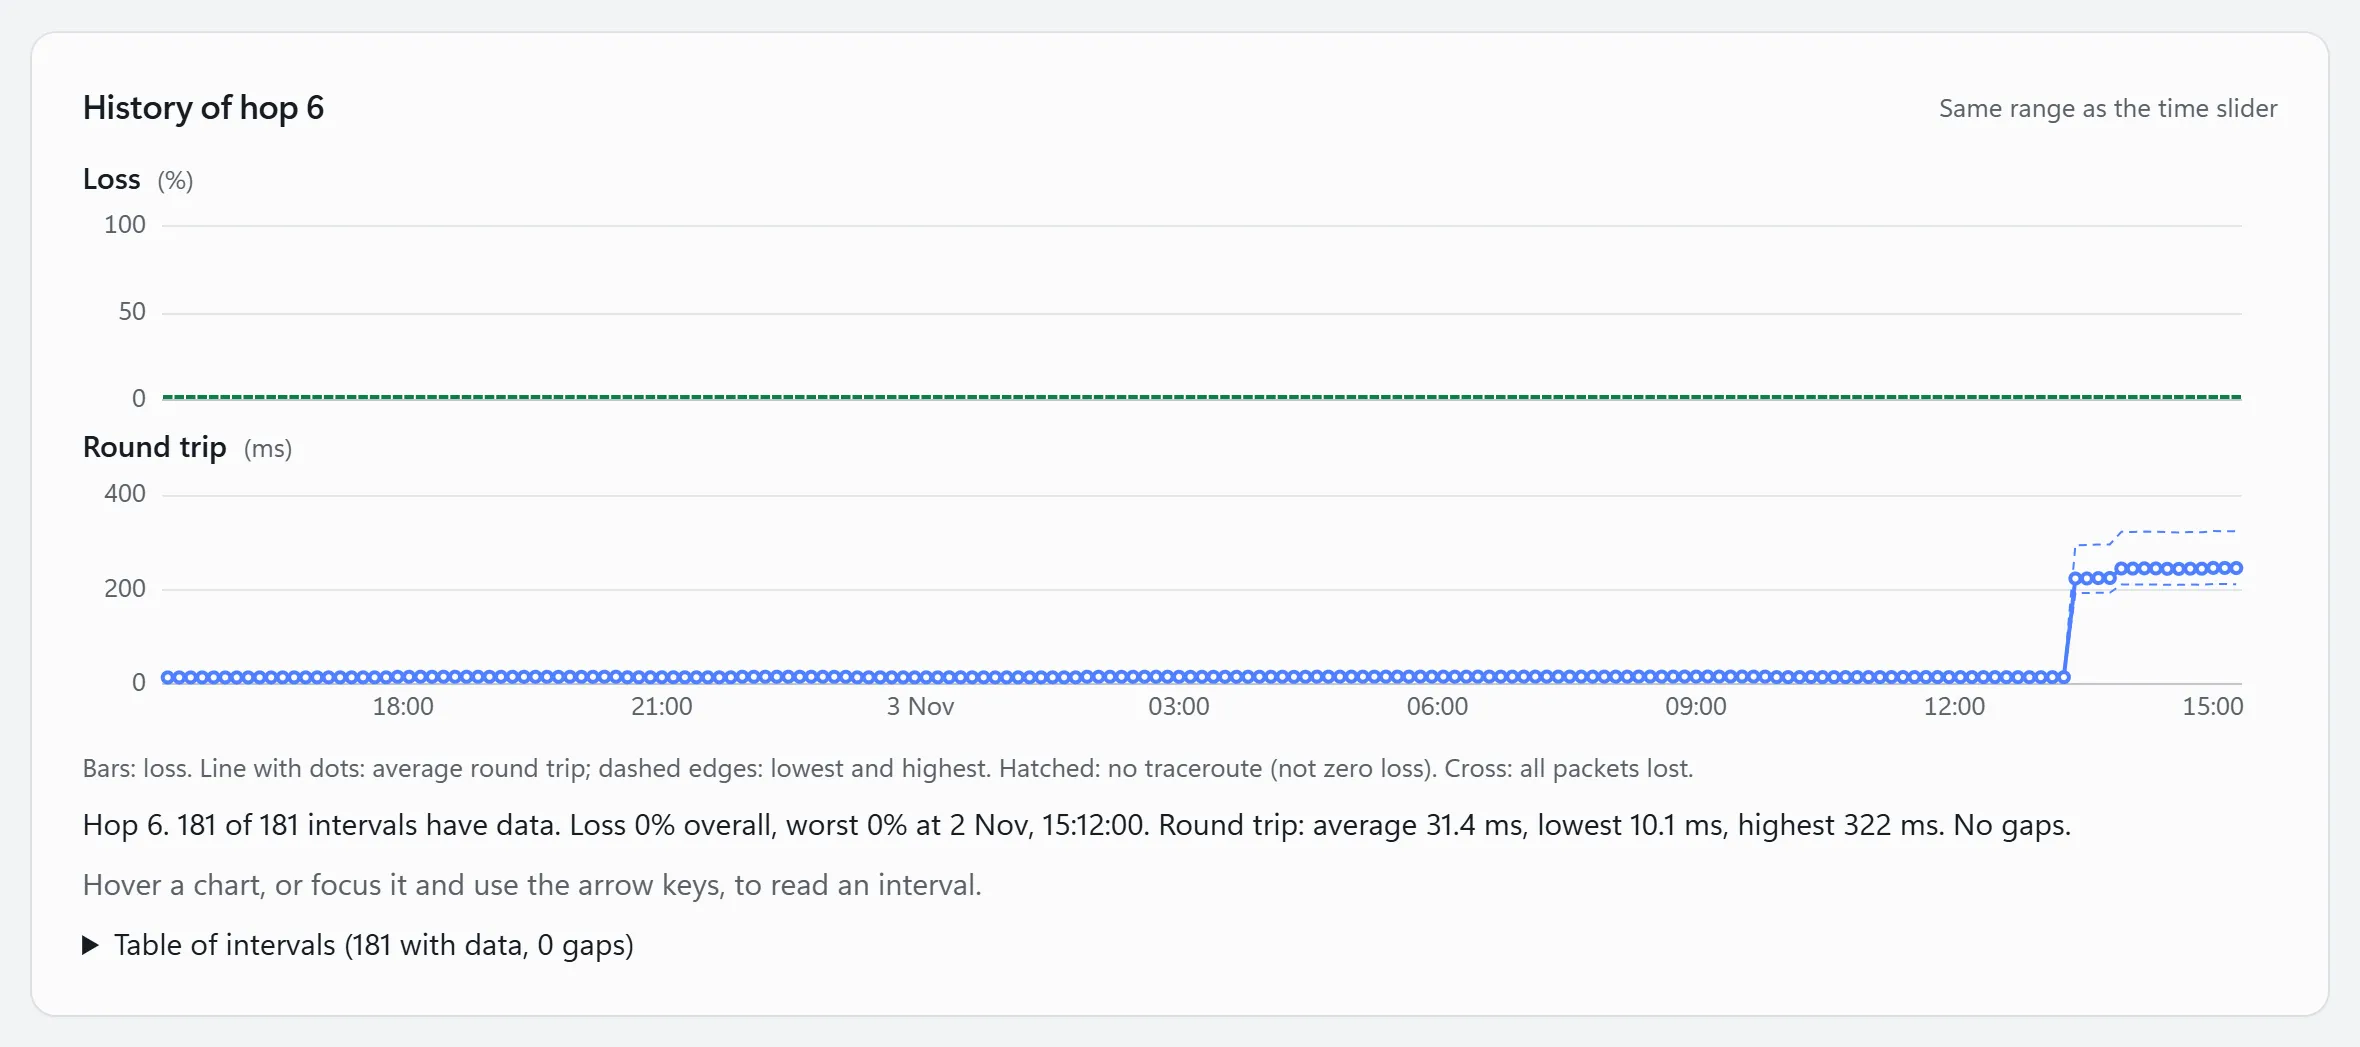
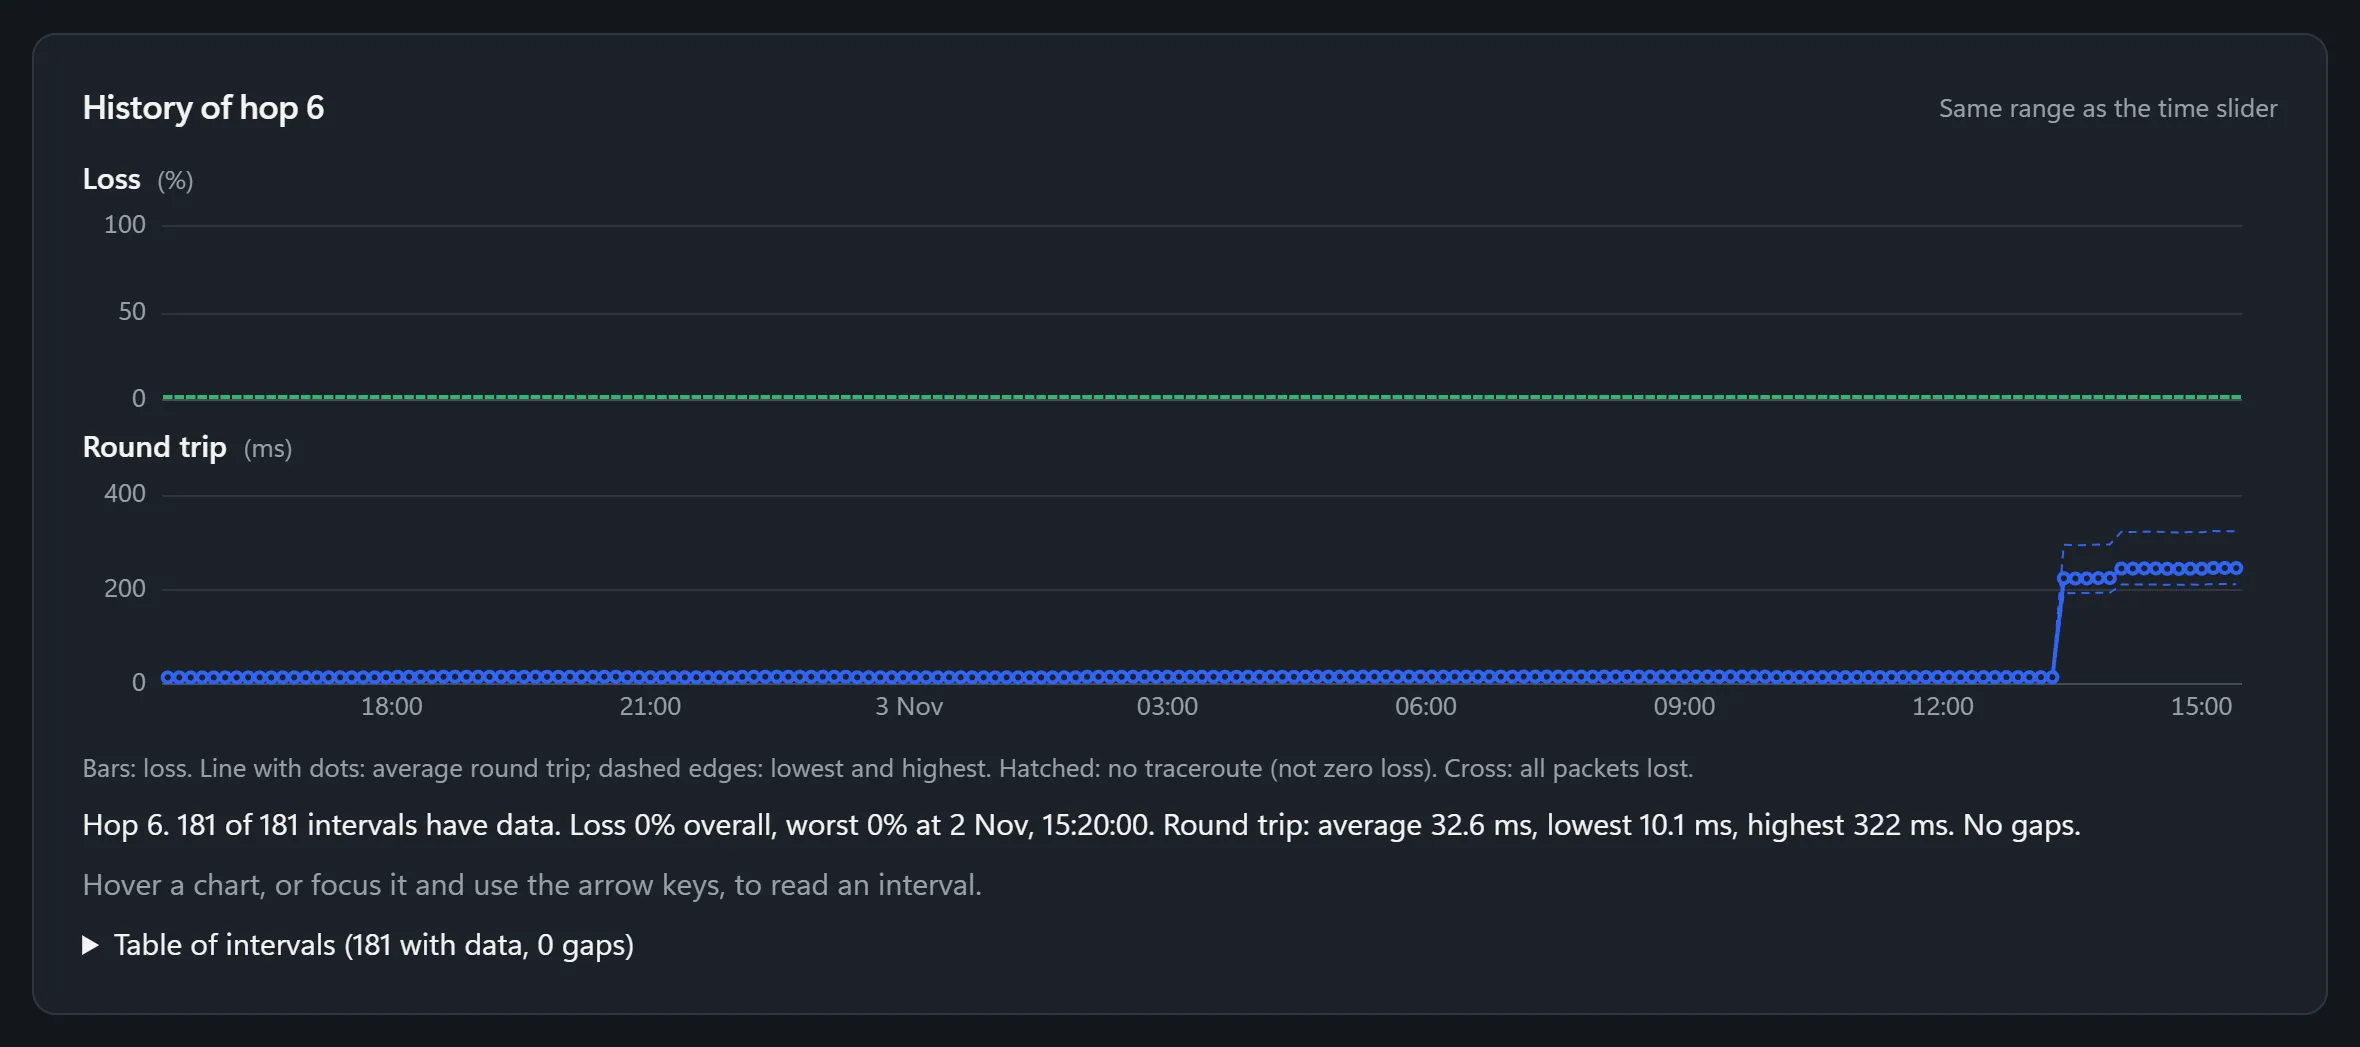
Pick a hop in the table and two charts appear for it, over the same range as the slider: its loss, and its round trip, with a band from the fastest reply to the slowest. A time with no traces is hatched and labelled, never drawn as zero loss.
Read a hop together with the hops after it. Many routers answer traceroute slowly while forwarding traffic at full speed, so a hop that looks slow while later hops are fast is a slow answer, not a slow path.
Take it to your provider.
A carrier ticket needs three things: where the delay starts, whose network that is, and what changed. FishEye shows all three on one page.
- The hop and its network: its address, AS number and owner.
- When the path changed: the diamond on the slider, and the trace before and after it.
- Trace now from any probe, or once from the server, to show the provider the path as it is.
There is no trace export or share link yet: you copy the hops and times into the ticket.
A recorded investigation
How FishEye judges a path change.
A route that flips back and forth is not news. The path-change alert opens only when a new path holds.
- A change is an alert when
- Three traces in a row differ from the known path in the same way. Silent hops are ignored, traffic spread over several routers is not a change, and a trace that stops short of the target is left to the reachability checks. The new path then becomes the known one.
- How often it traces
- On the schedule you set per target, from once a minute to once a day, from every probe that runs it. Agents on users’ computers can trace up to 20 targets, at most once an hour. The server traces only when you ask.
- How long it keeps it
- Every trace for 90 days.
- How it traces
- With ICMP echo, the same message a ping uses, by default. UDP, as classic traceroute does, or TCP to a port you pick, for networks that drop the others. Three packets per hop, up to 30 hops.
- Alerts
- A path-change alert is optional: it runs only for the targets you give it a rule for.
- What it looks up outside
- Only public hop addresses, for their network and place, and only while those lookups are switched on. Private addresses are never sent.
A known limit. Hop charts over a long range are averaged: over 30 days each point covers 4 hours, so a short spike shows best over a shorter range.
Show us the path that keeps going wrong.
Tell us which carrier you chase most, and we will show you what FishEye finds on its path.