Your routers already report who talked to whom, and how much. The Flow add-on collects those reports and lets you ask them questions: which host, which port, which network, which interface.
Flow is an optional add-on. It is included from plan T3.
A recorded investigation
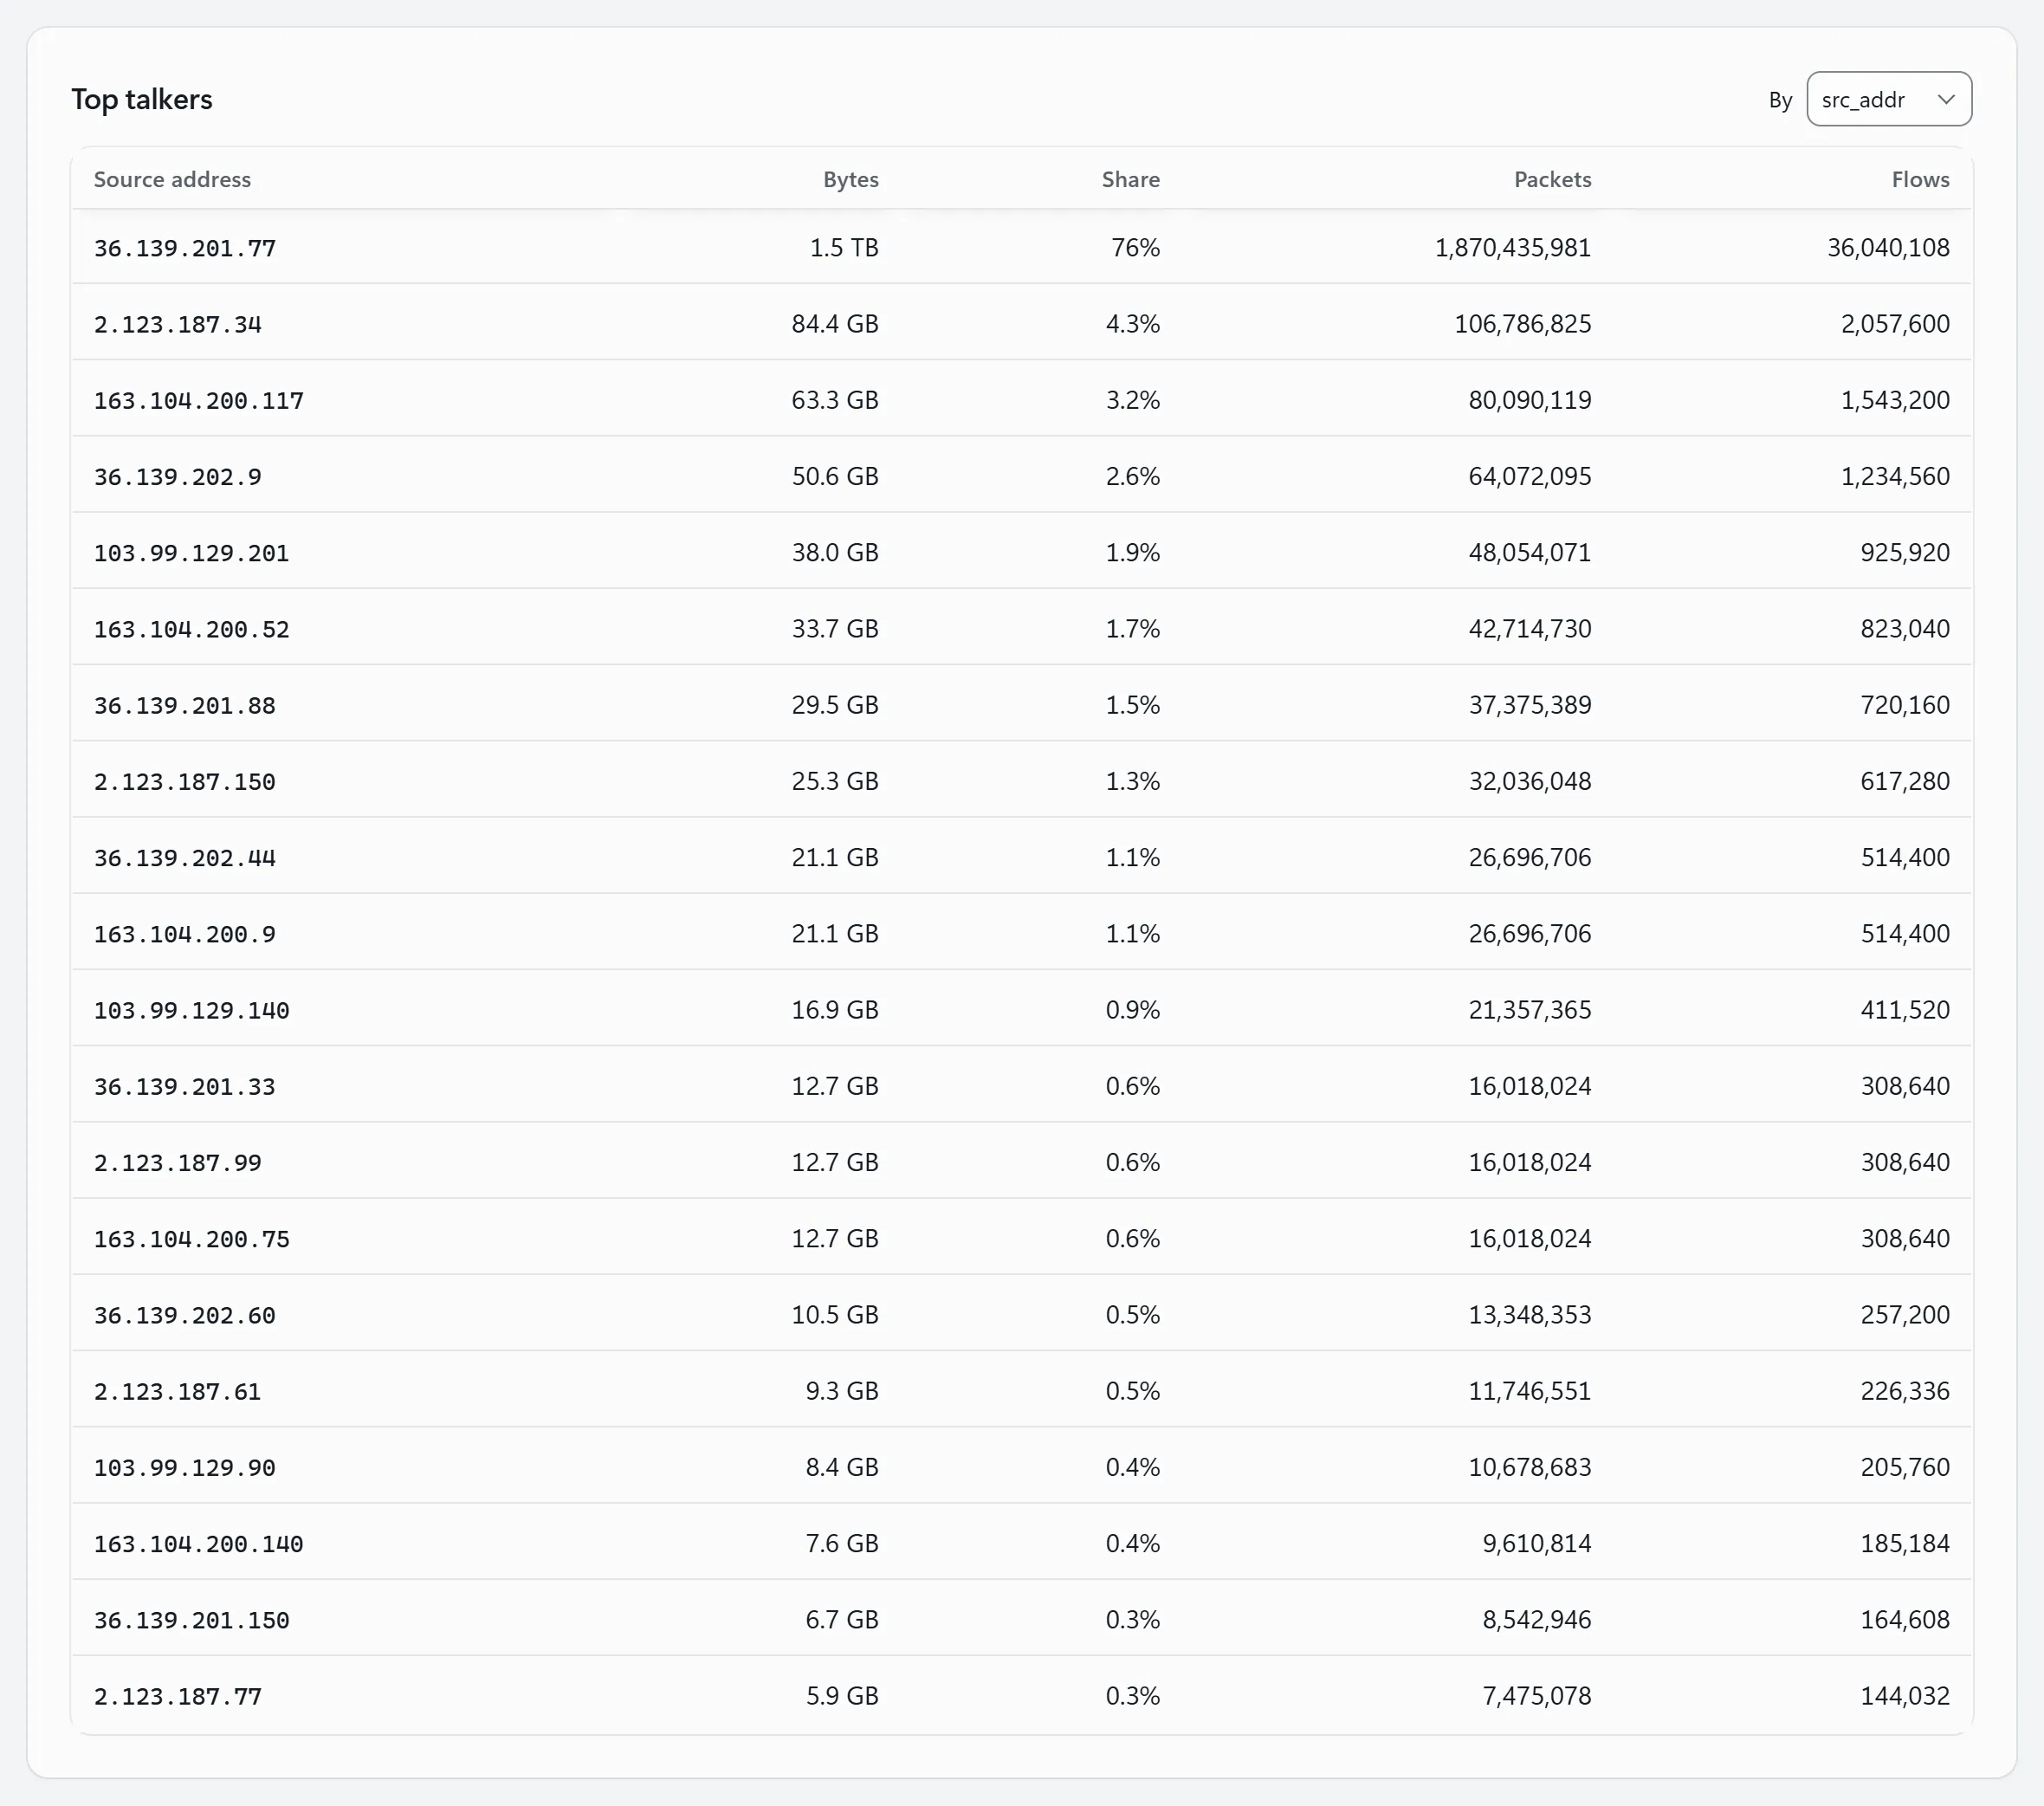
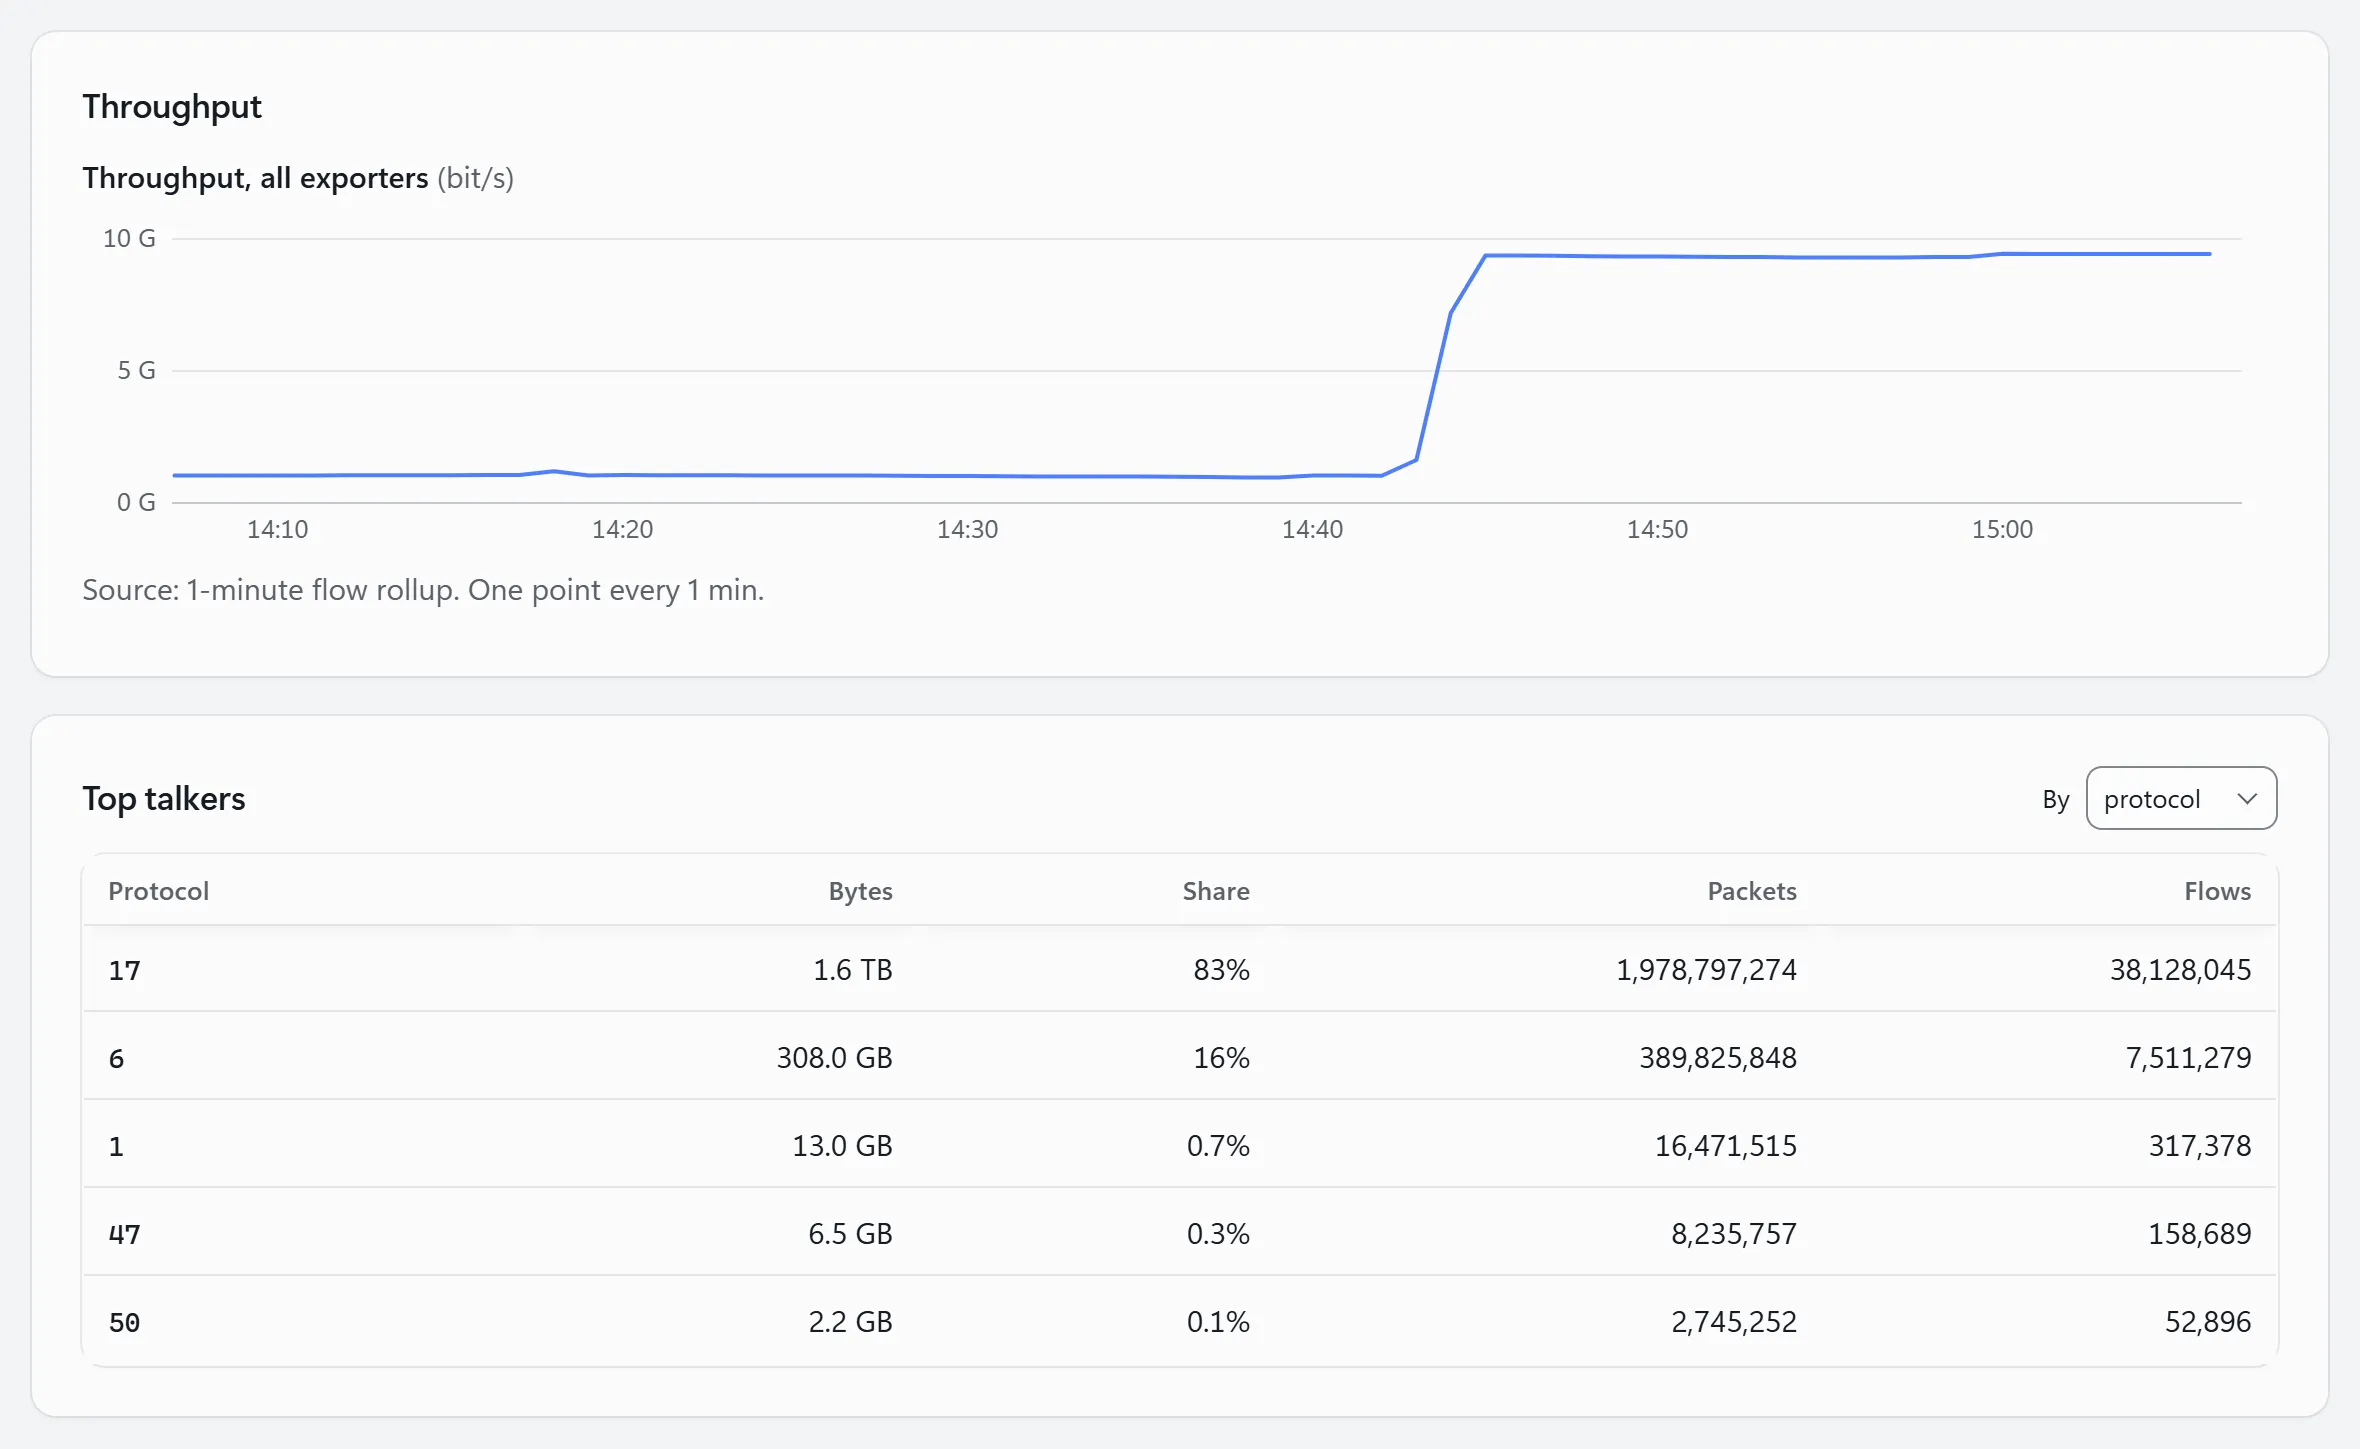
The real FishEye console, recorded on a demo network. Flow throughput jumps from about 1 Gbps to 9. Ranked by protocol it is mostly UDP; by source, one address sent three quarters of it; by destination, it is aimed at one host. FishEye does not flag a flood like this by itself: this is someone looking. Addresses are made up.
Switch on flow export on the router: a short summary of each conversation it carries, who talked to whom, on which ports and how many bytes. Send it to the FishEye collector at that site, on UDP port 2055 or 4739. A router FishEye already polls over SNMP at that site is accepted as it is; any other sender is dropped and listed, so you can approve it.
2
FishEye keeps it
The collector decodes the records, keeps them on its own disk until the server has them, and the server stores them. Every record is kept for 3 days, one-minute summaries for 7 days, and hourly summaries for 400 days.
3
You ask questions
Pick a time window and a router, or all of them. Chart the throughput, and rank the traffic by host, port, protocol, network or interface.
What you can ask
One question at a time.
Each of these is a view in FishEye. The screens below are the real console on a demo network; every address and provider name is made up.
Top talkers
See who sent it
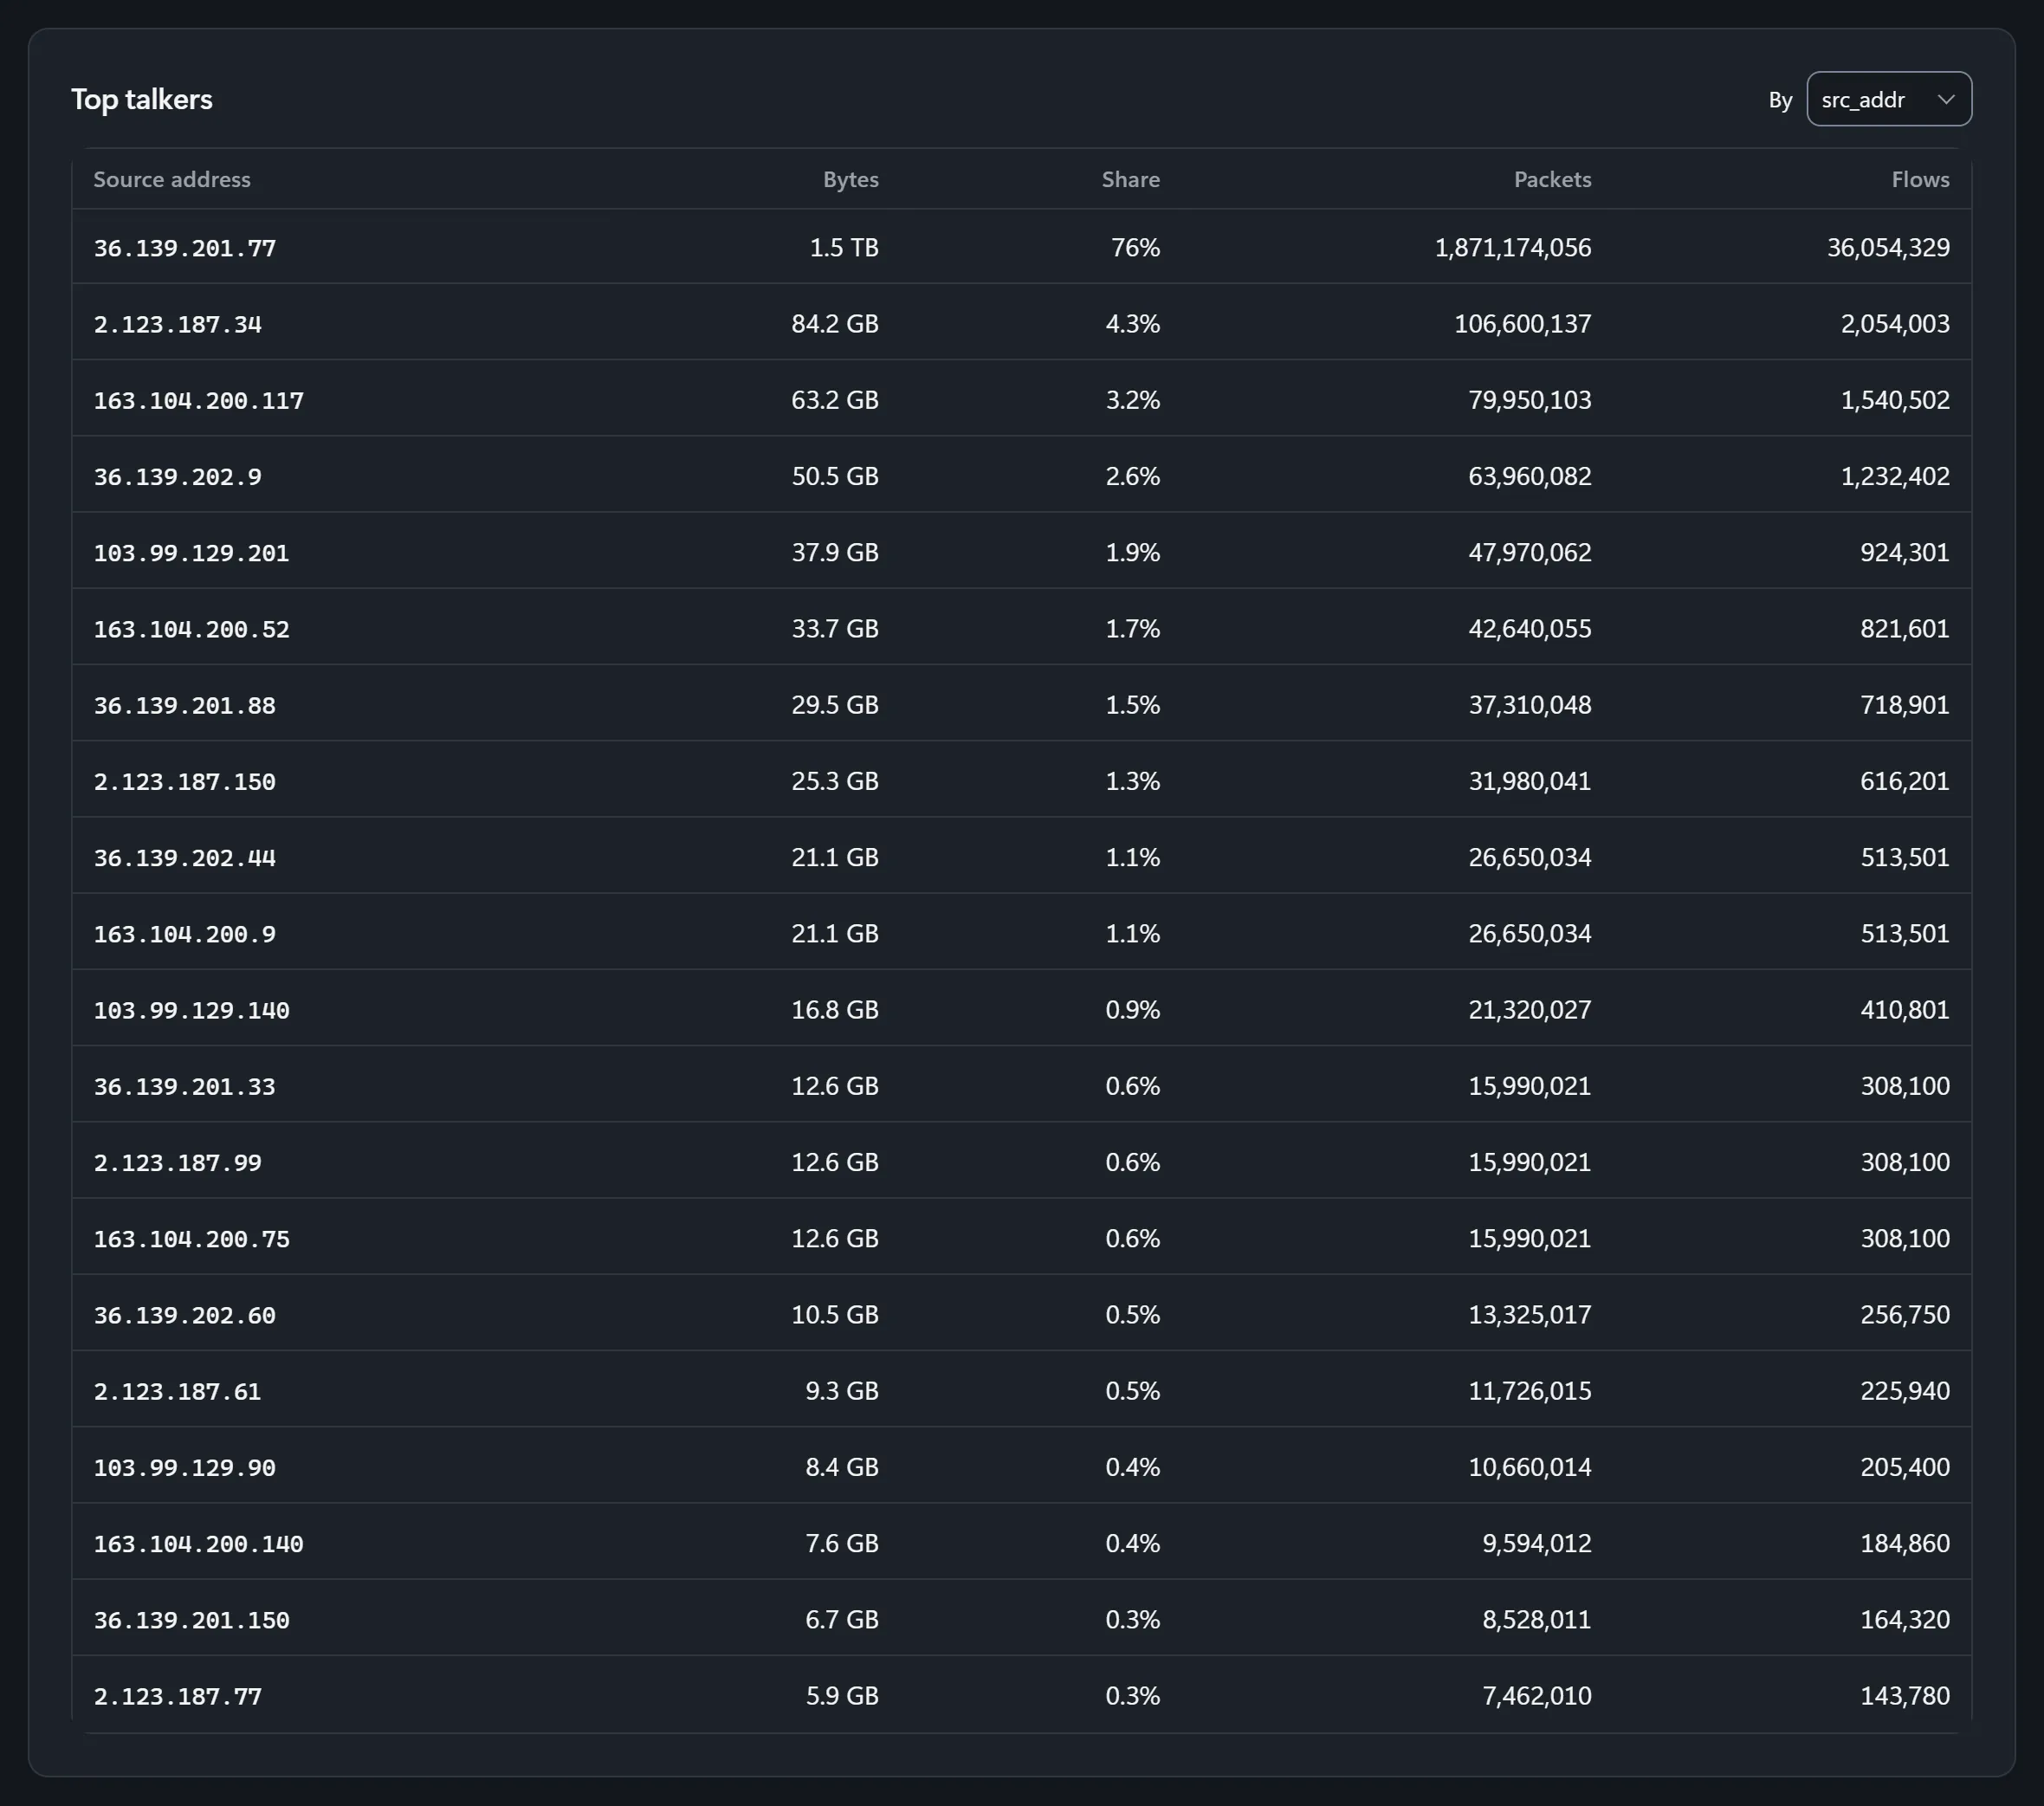
Top talkers ranks the 20 hosts that sent or received the most traffic in the window you pick, with each one’s bytes, share, packets and flows. Above it, the throughput chart shows when the traffic arrived. Narrow both to one router to see one link.
One source, 36.139.201.77, sent three quarters of the bytes in the window.
By protocol and port
Split it by protocol and port
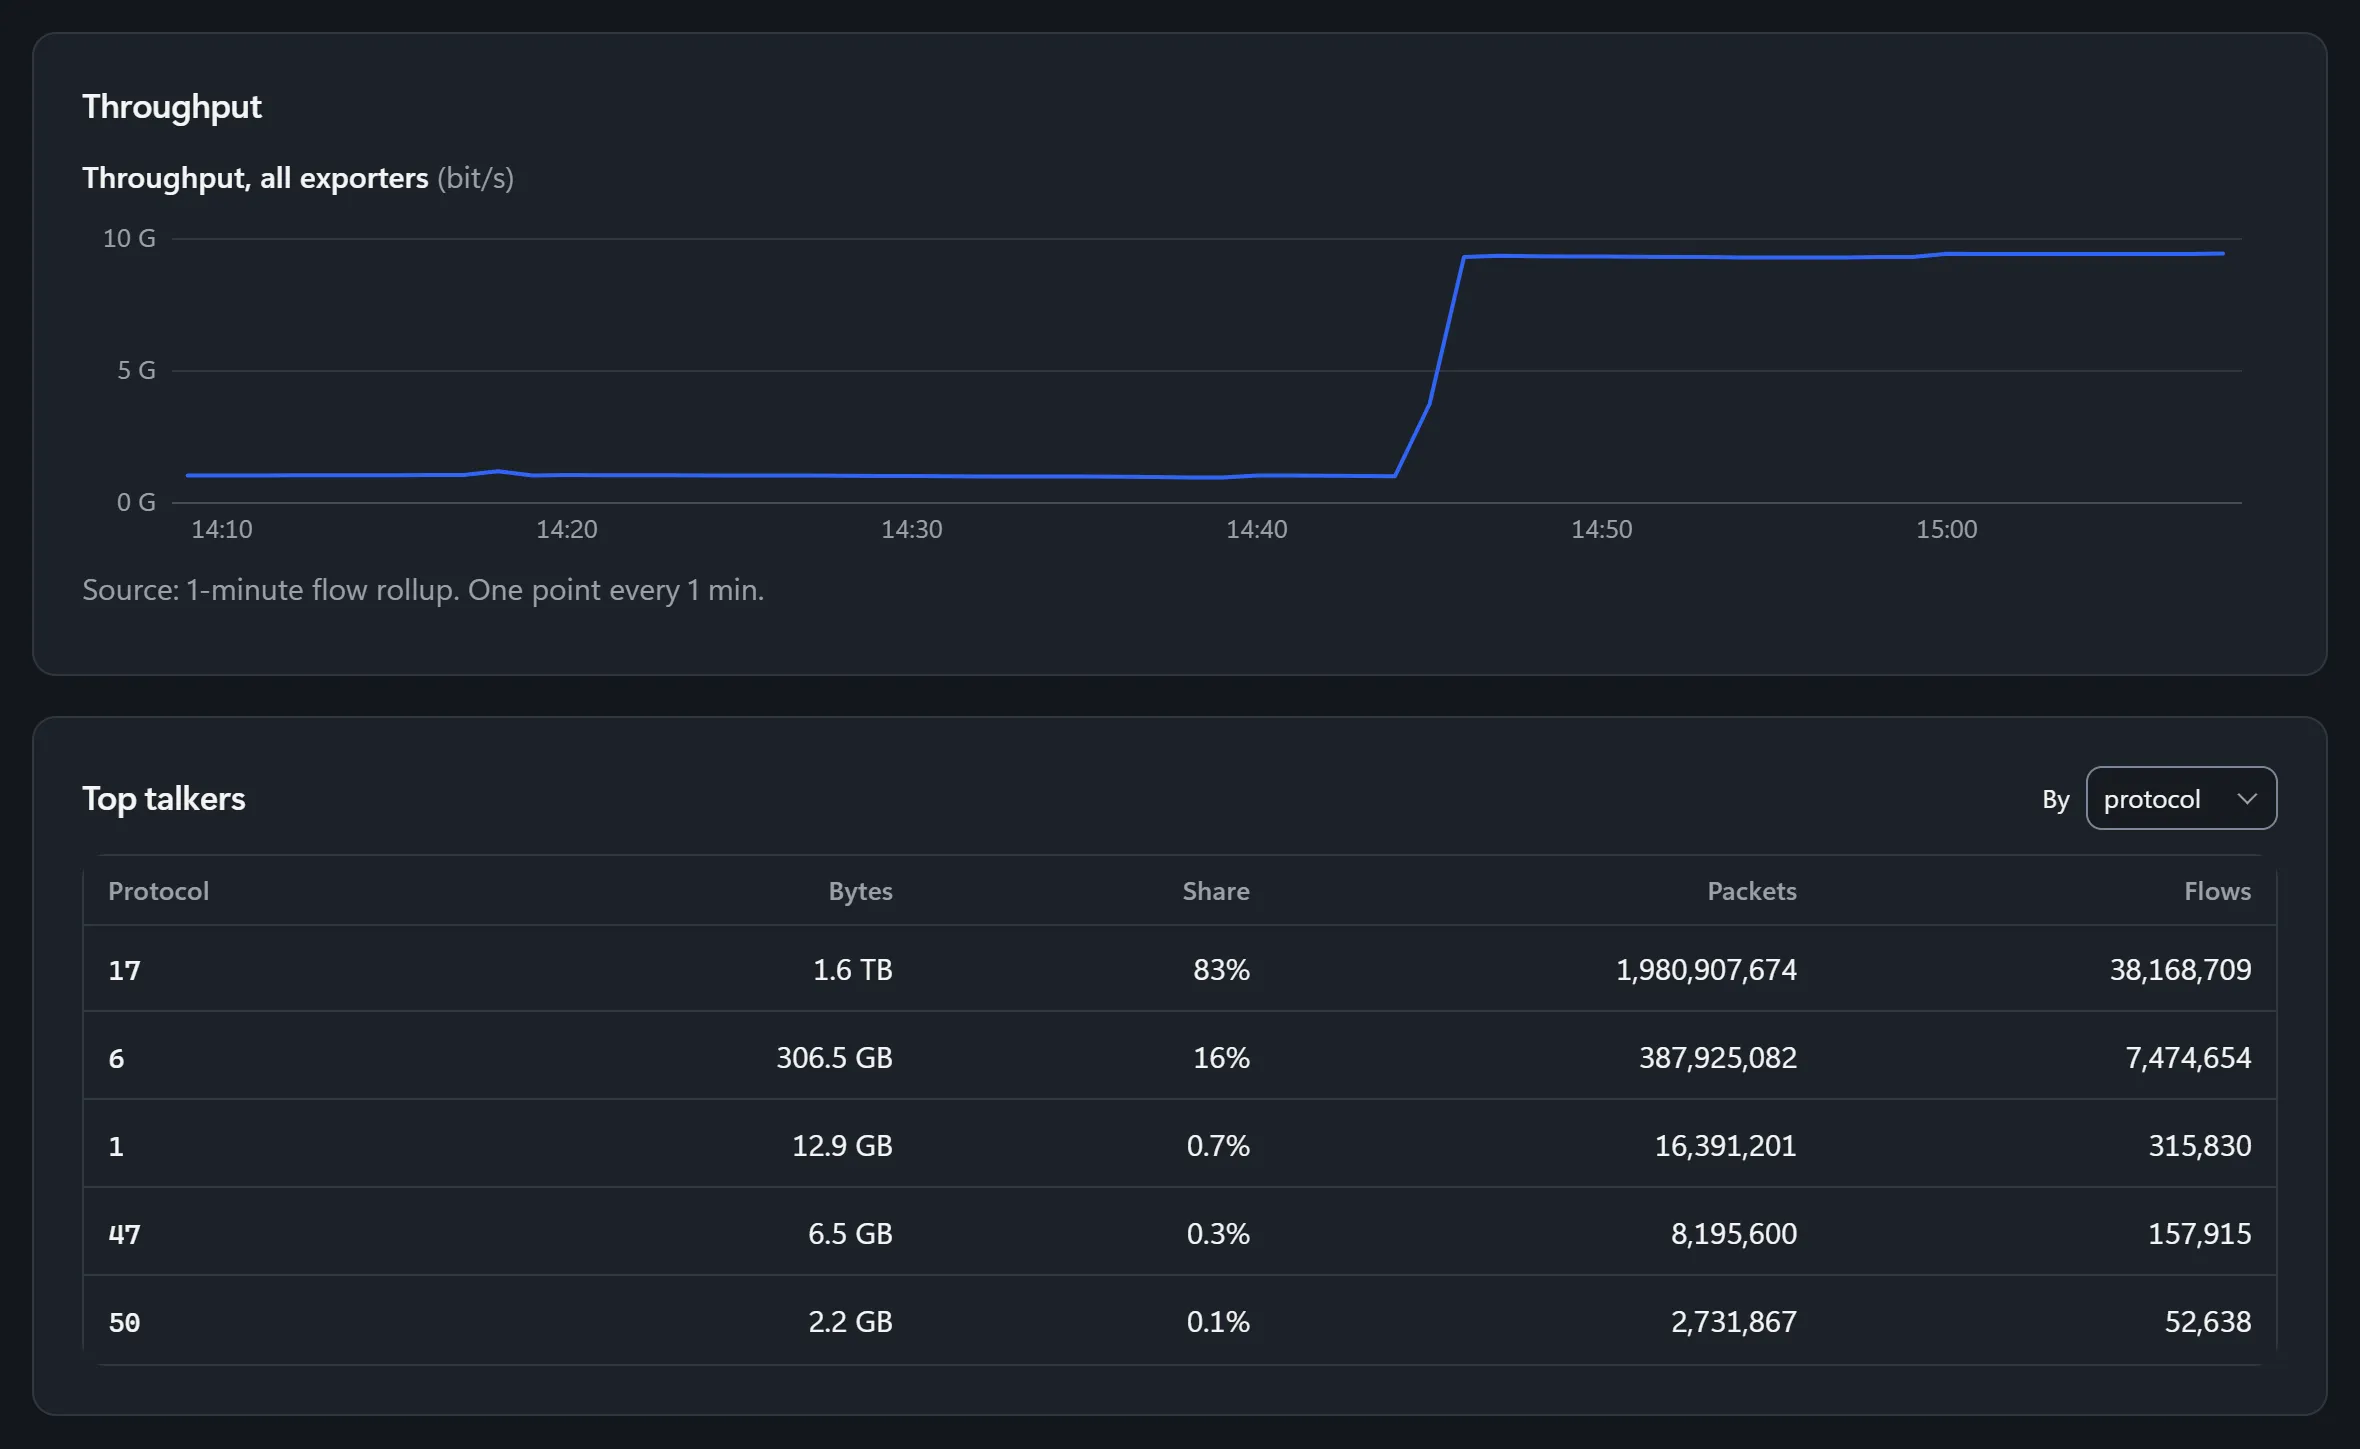
Rank the same window by protocol, to see TCP, UDP and the rest, or by destination port, to see which service it is. Pick the router and the window, and the list follows.
Ranked by protocol: 17 is UDP, with 82% of the bytes once the traffic jumps.
By network
Name the network
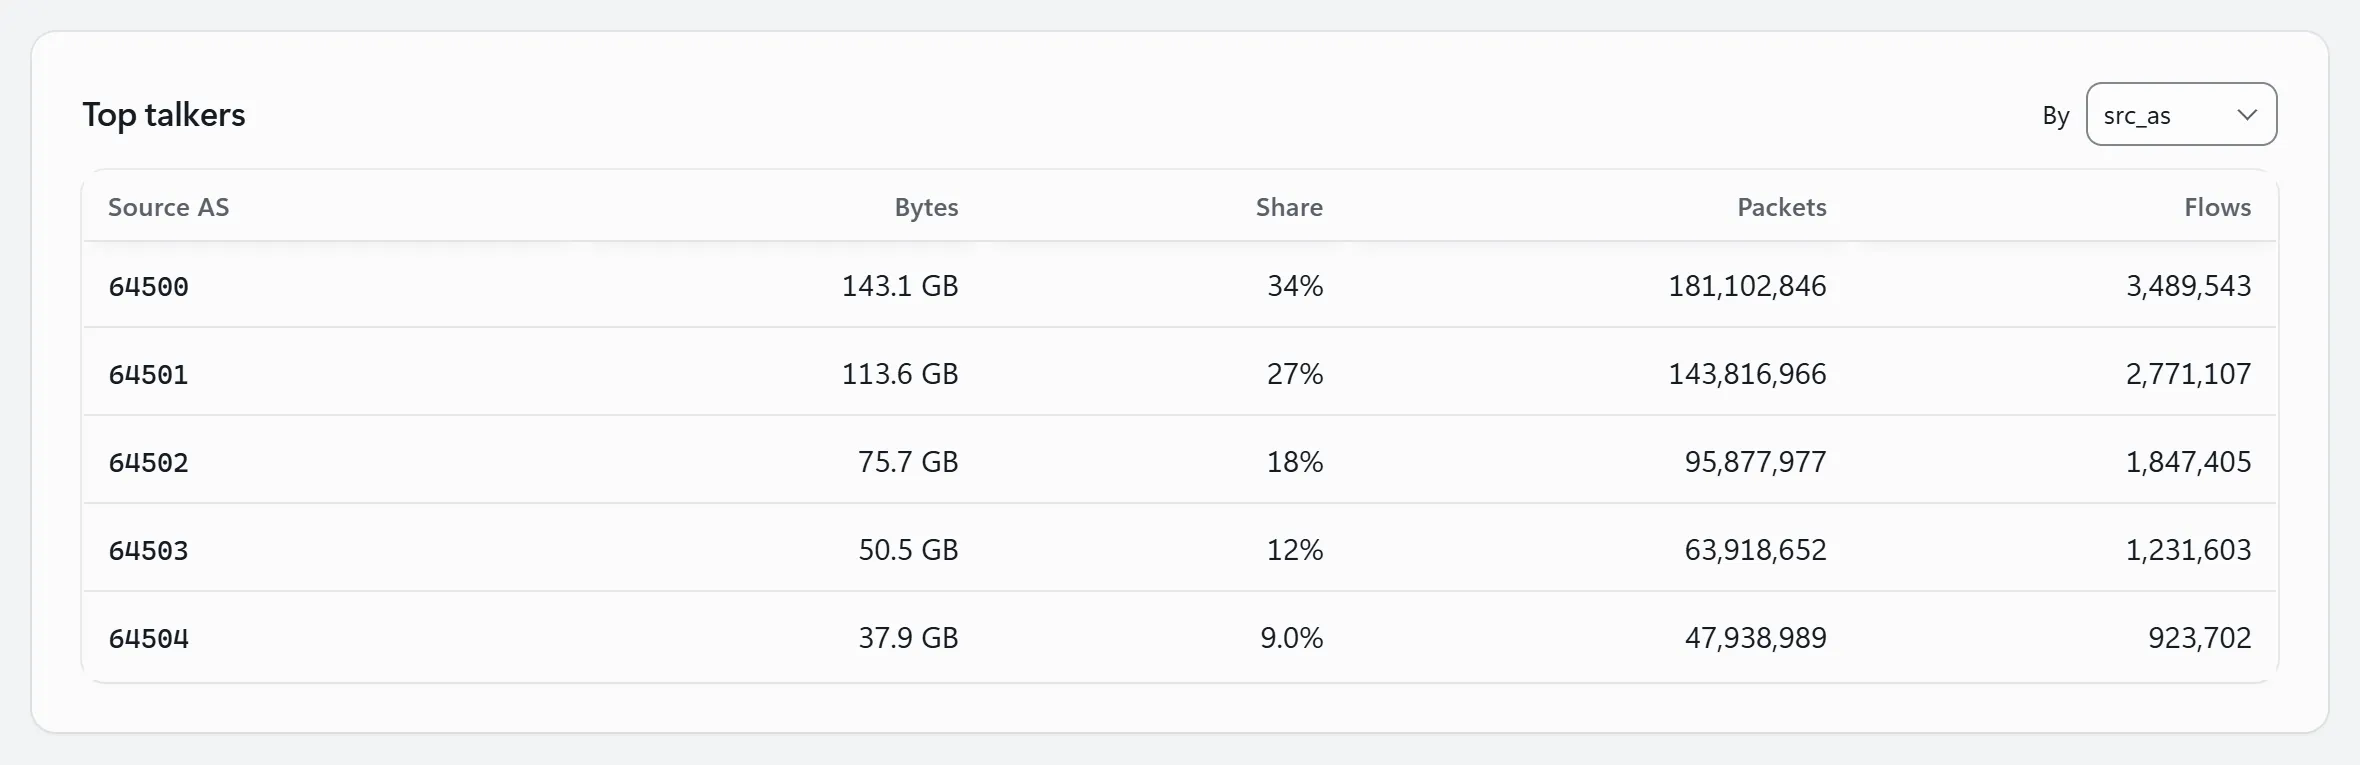
Every network on the internet, a carrier, a cloud company or your own, has a number: its AS number. Rank traffic by source or destination AS to see which networks it comes from and goes to. It needs your router to put AS numbers in its flow export.
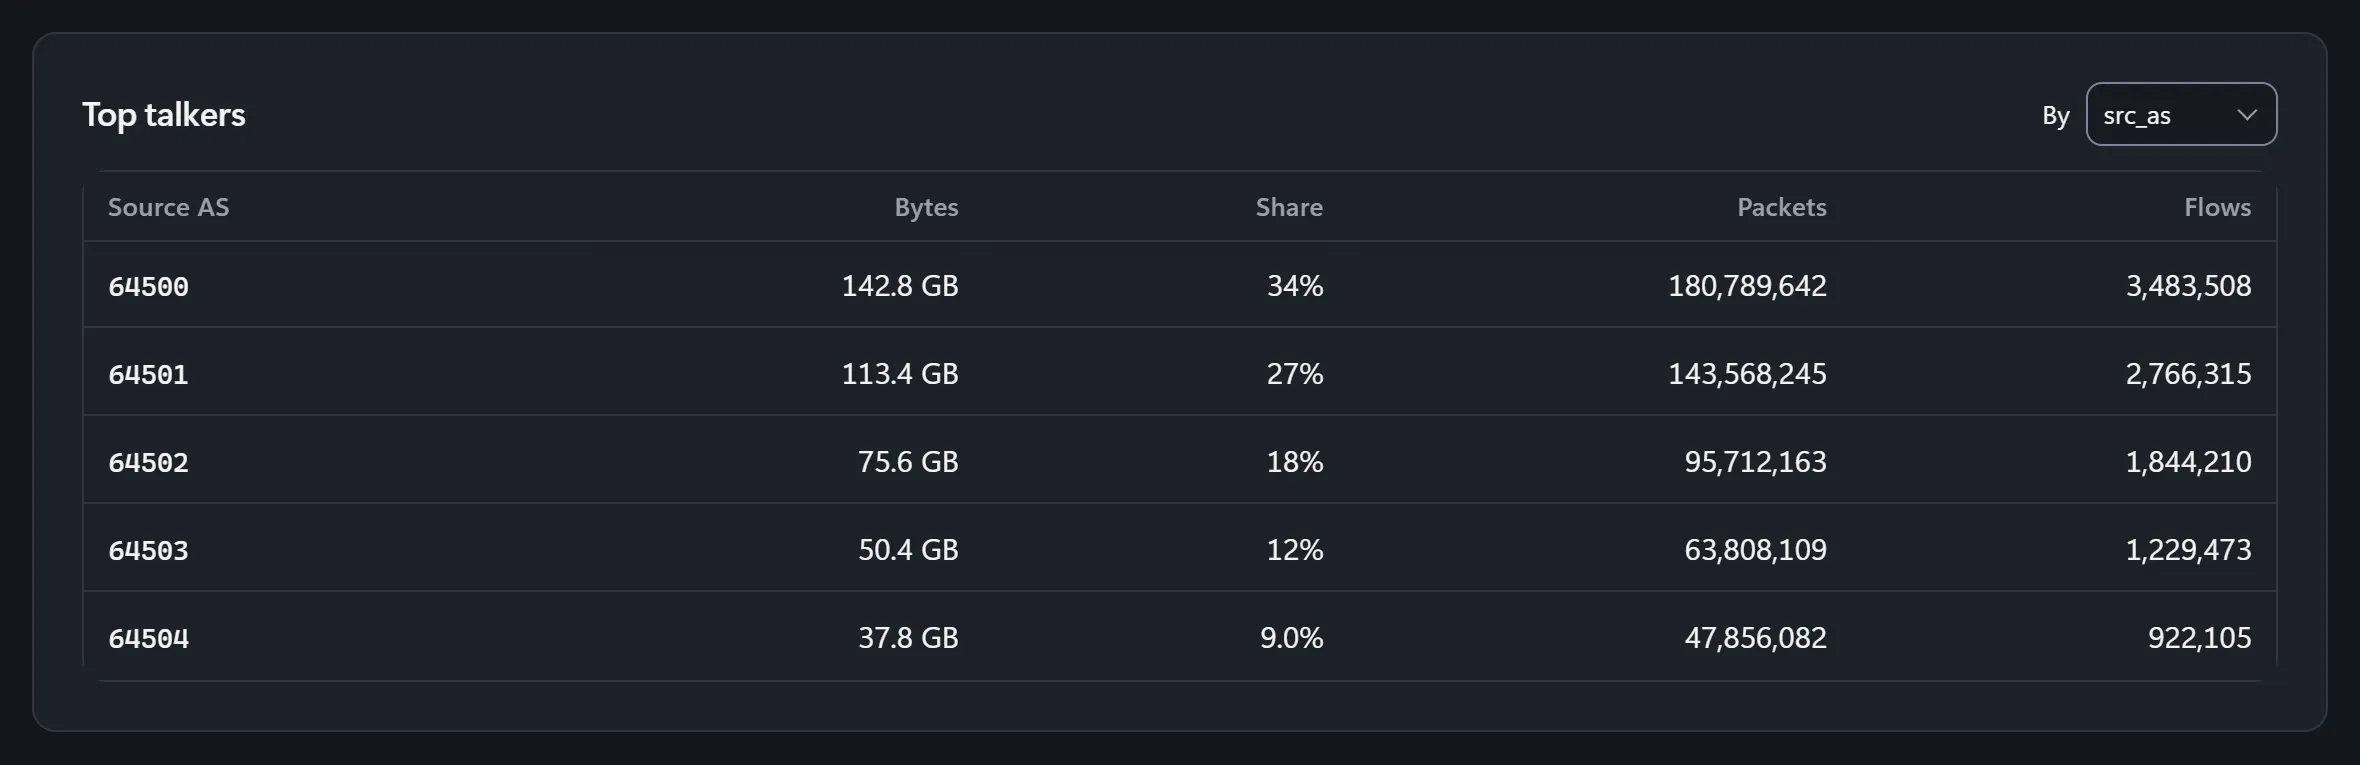
Ranked by source AS over an hour. The AS numbers are made up.
Traffic maps
See what is on one link
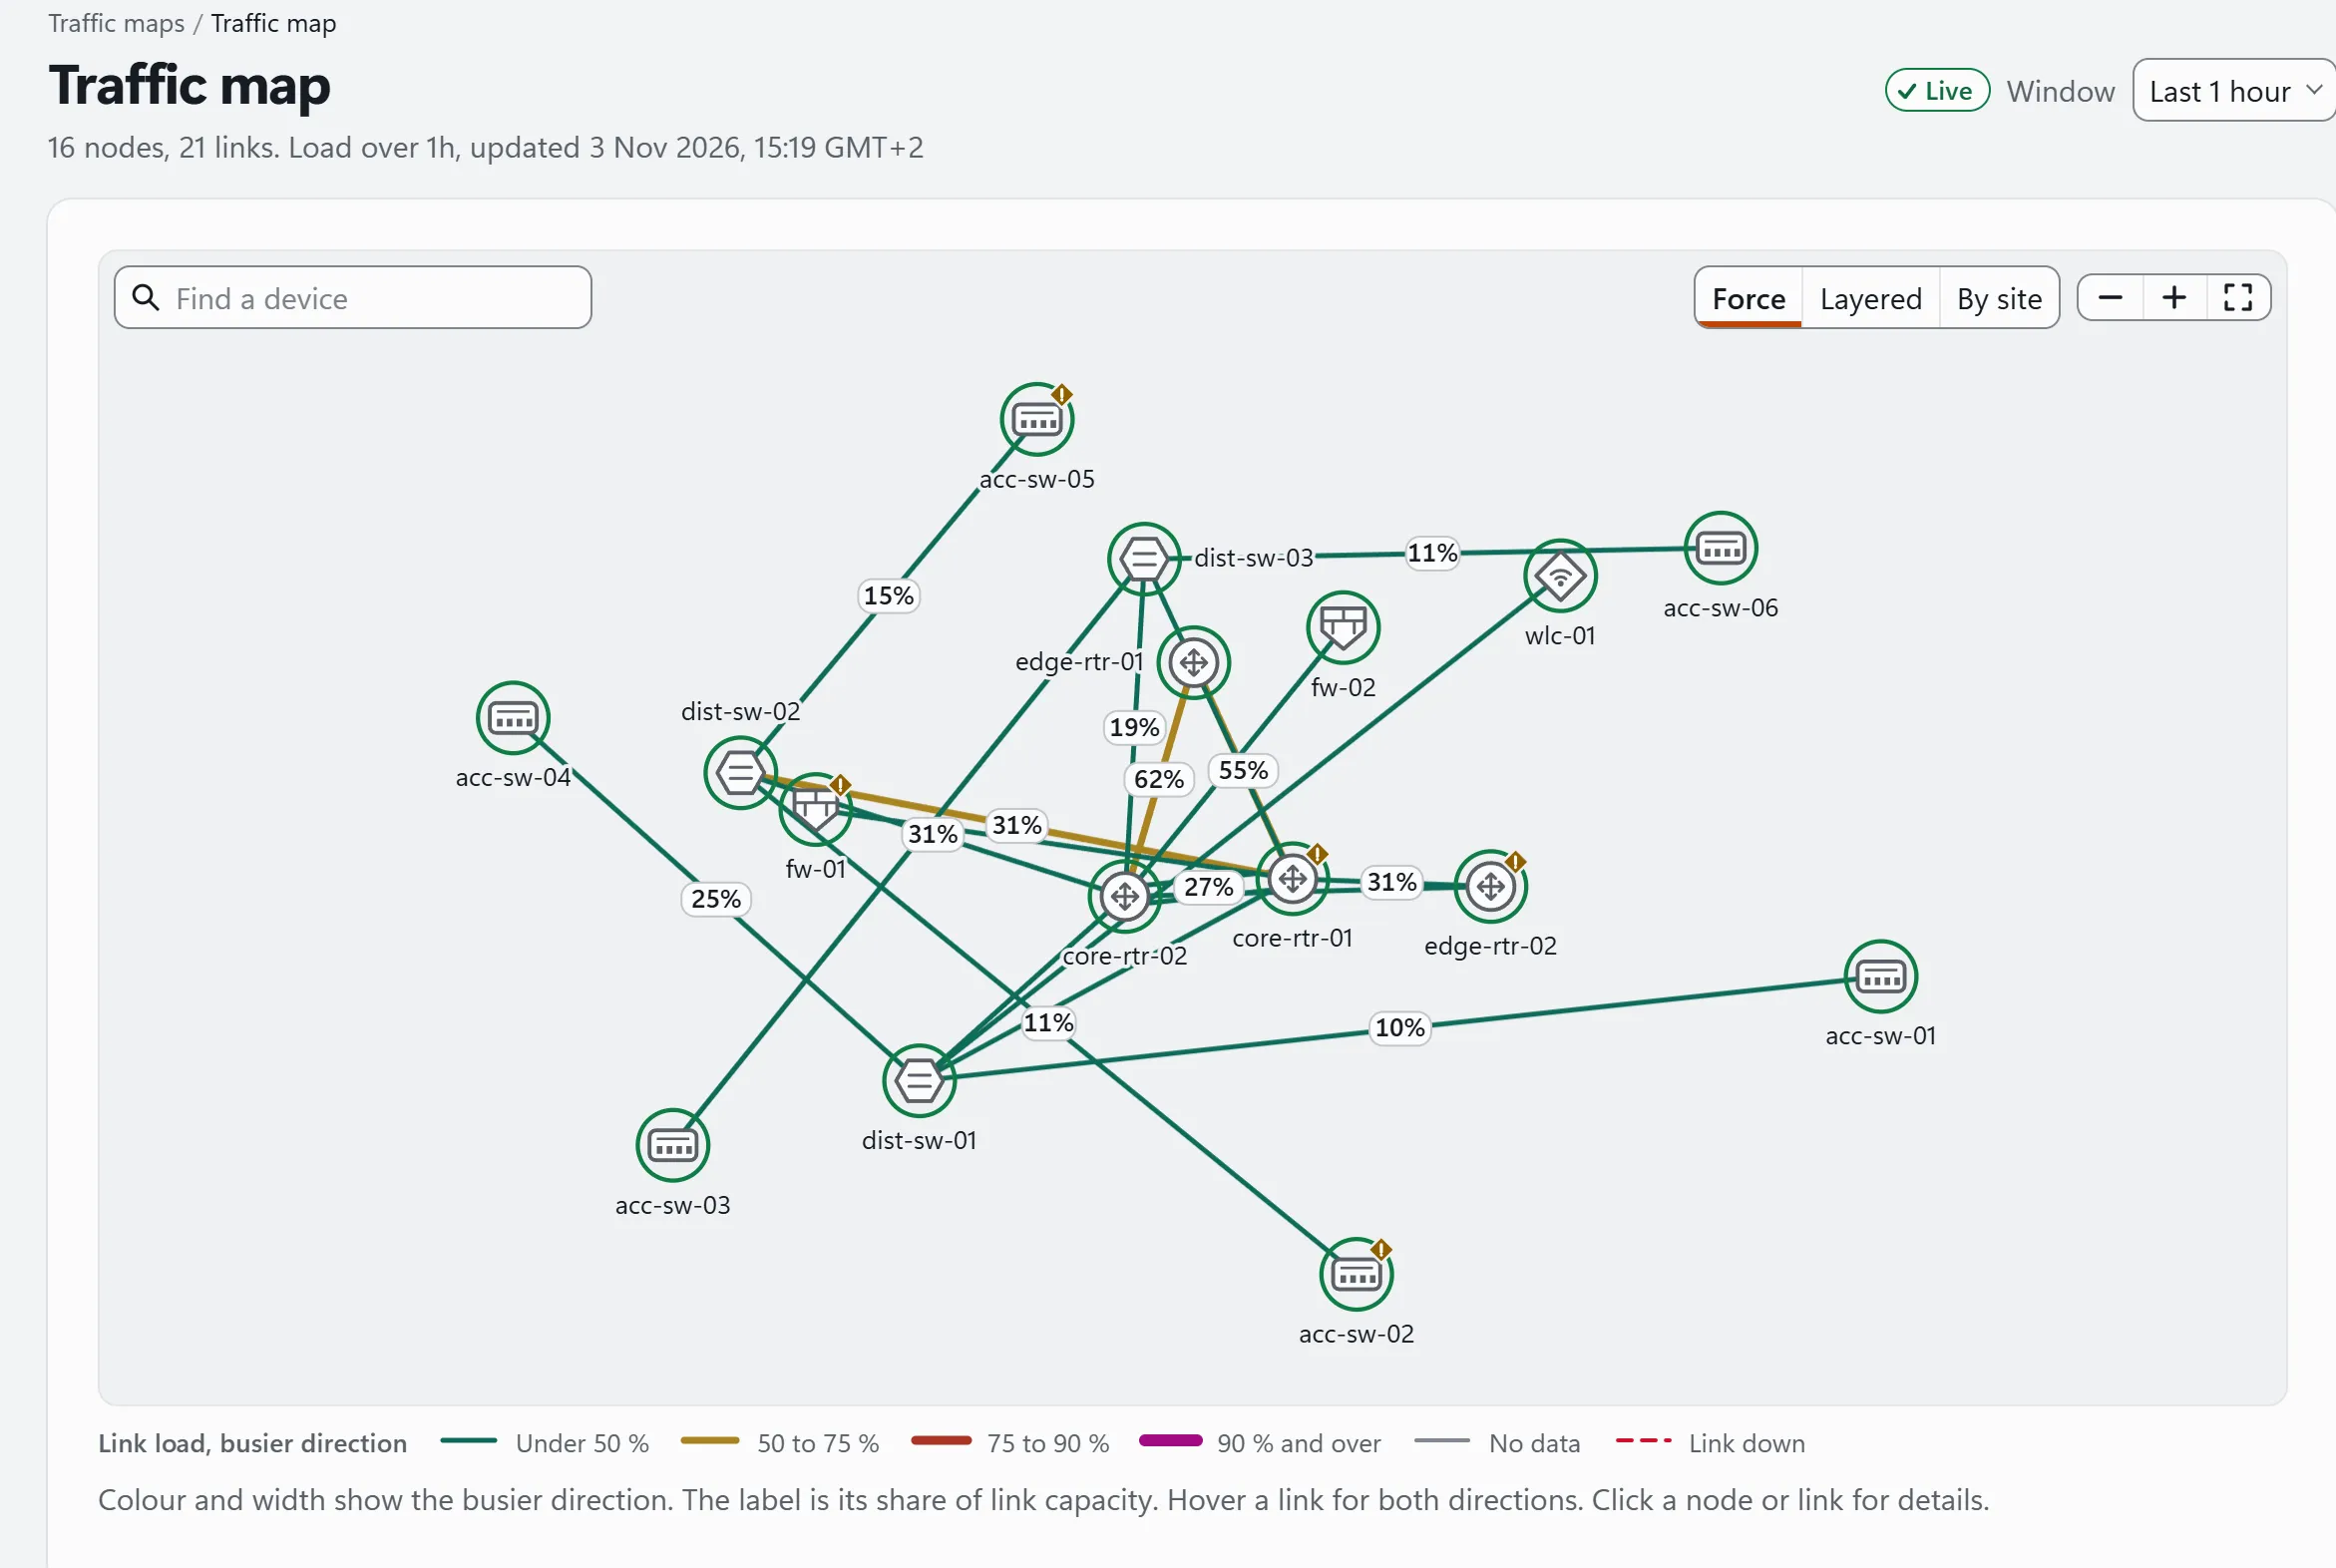
A traffic map draws your devices and the links between them, coloured by how full each link is from SNMP, and updates every 30 seconds. With flow, open a link and see the top talkers across that interface, in each direction.
Traffic maps come with the SNMP module; the view of what is on a link also needs flow.
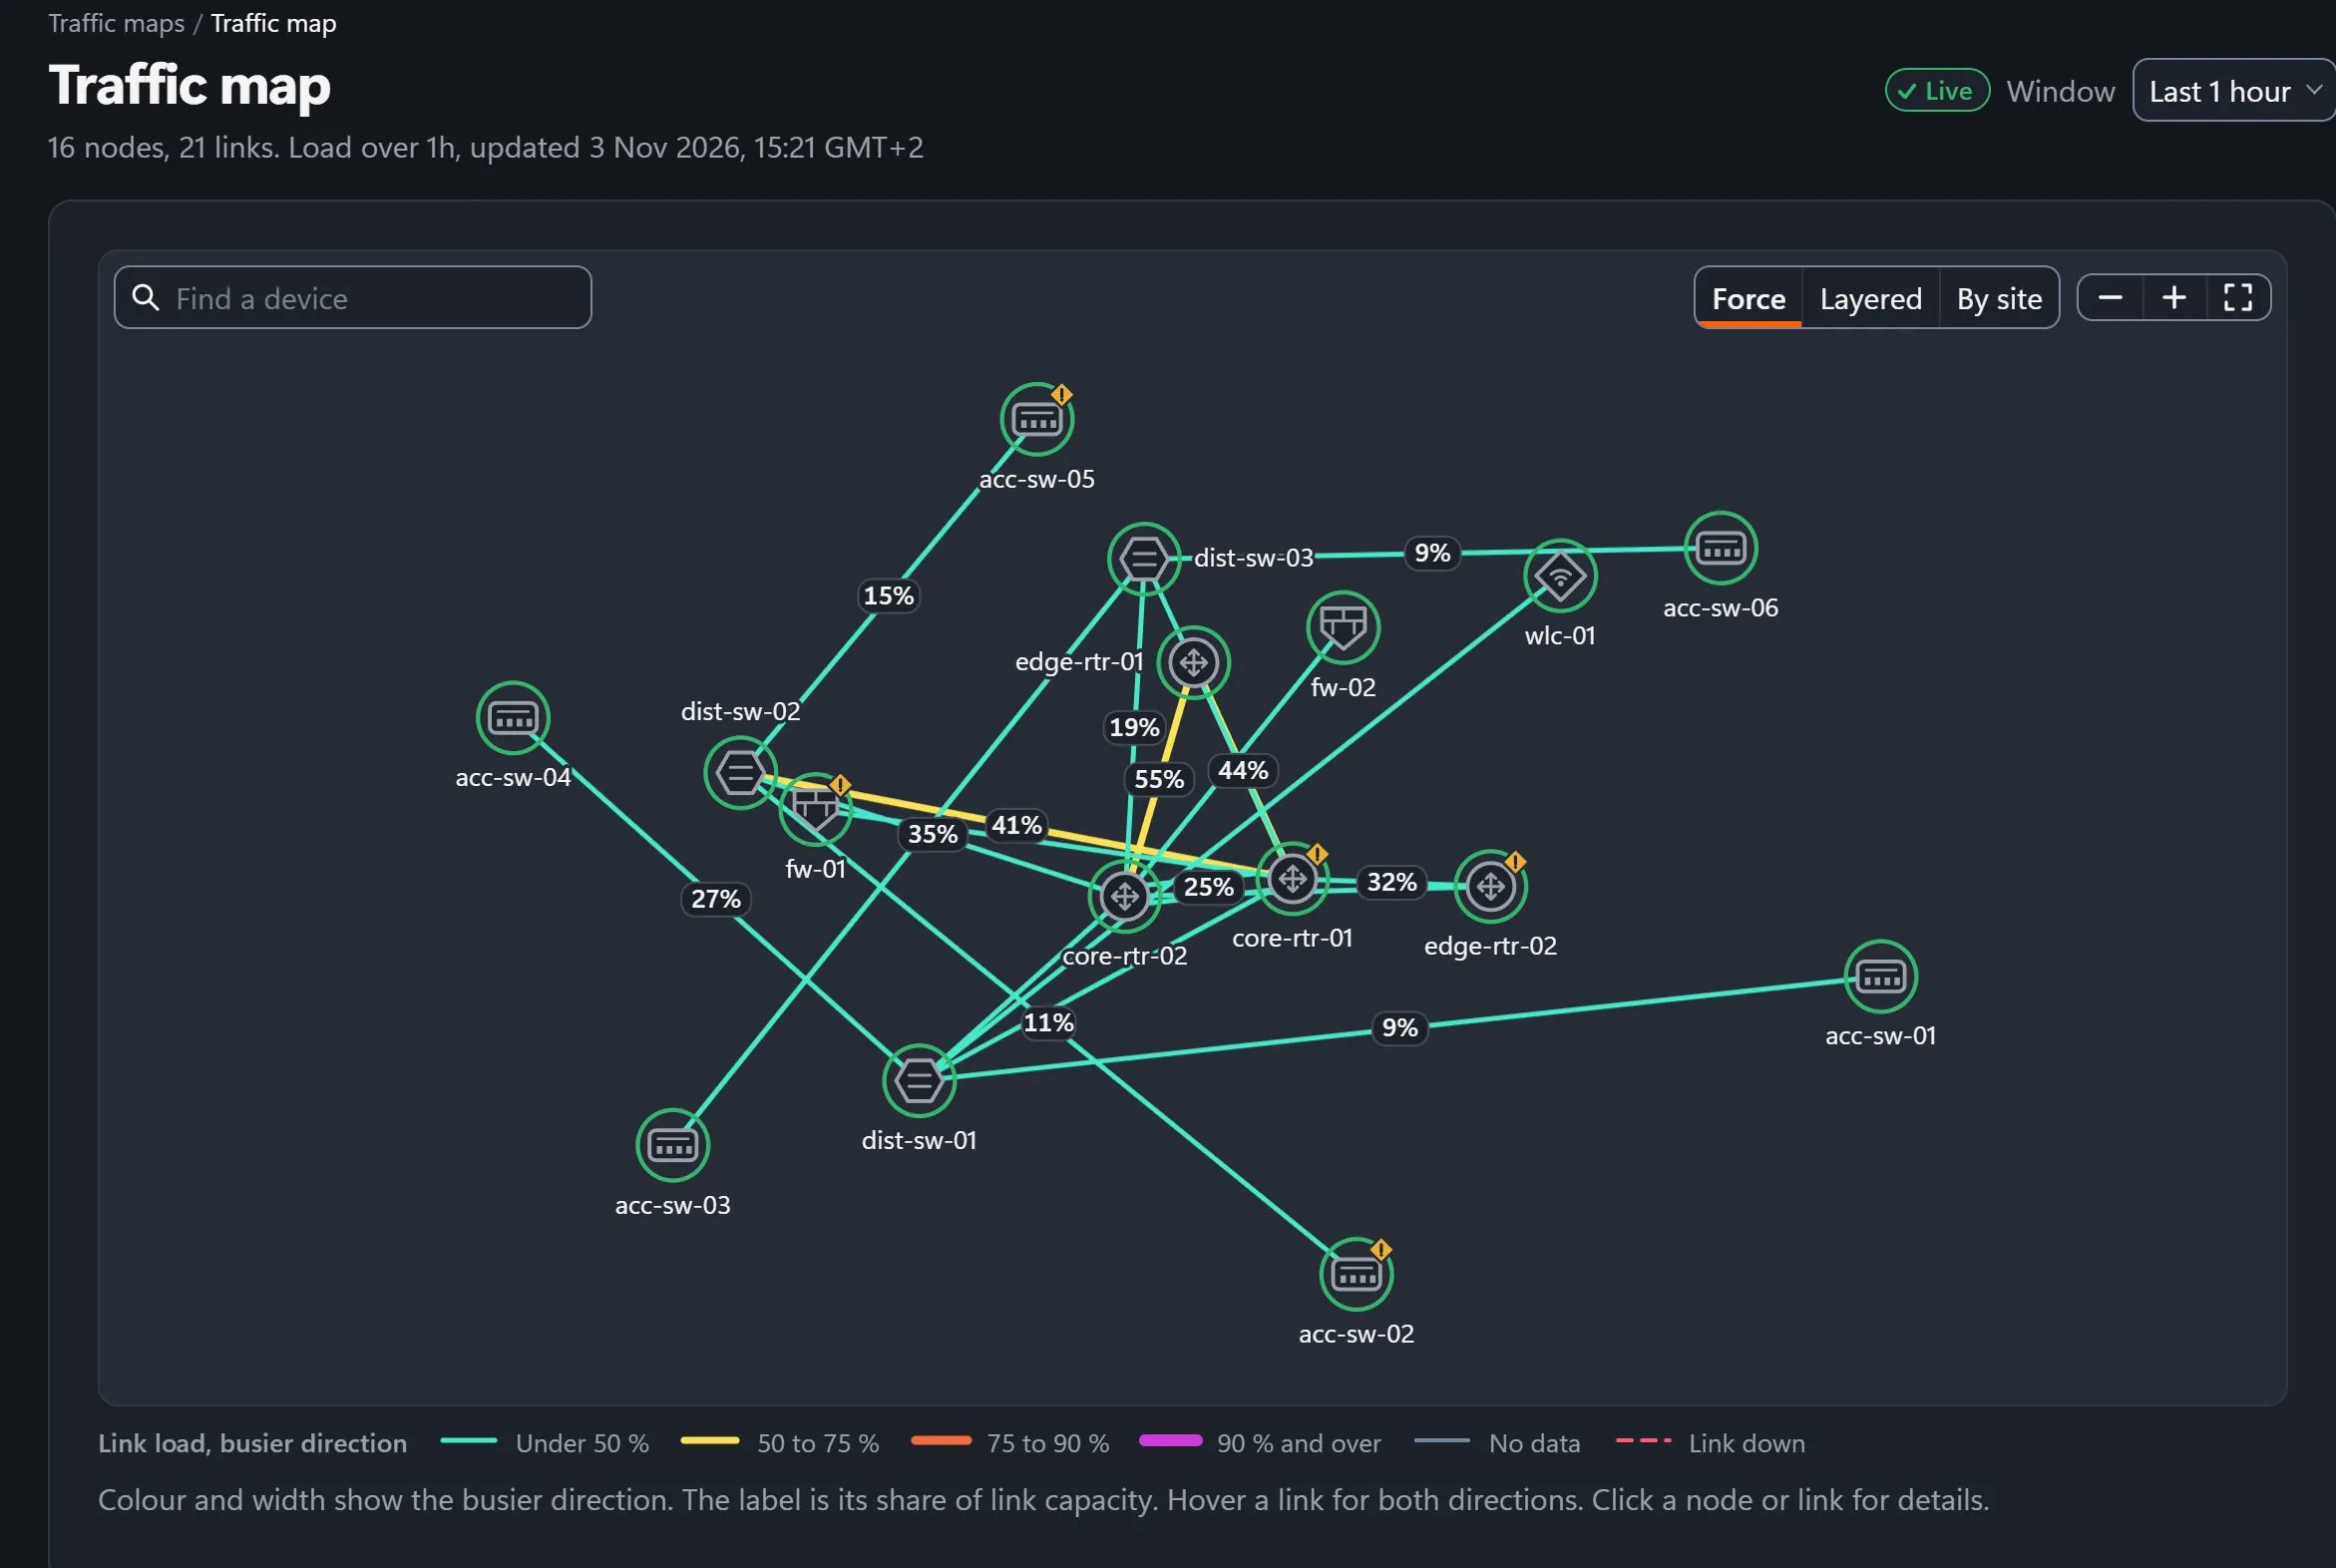
Every link labelled with how full it is. The devices are made up.
Circuits
Check the transit bill
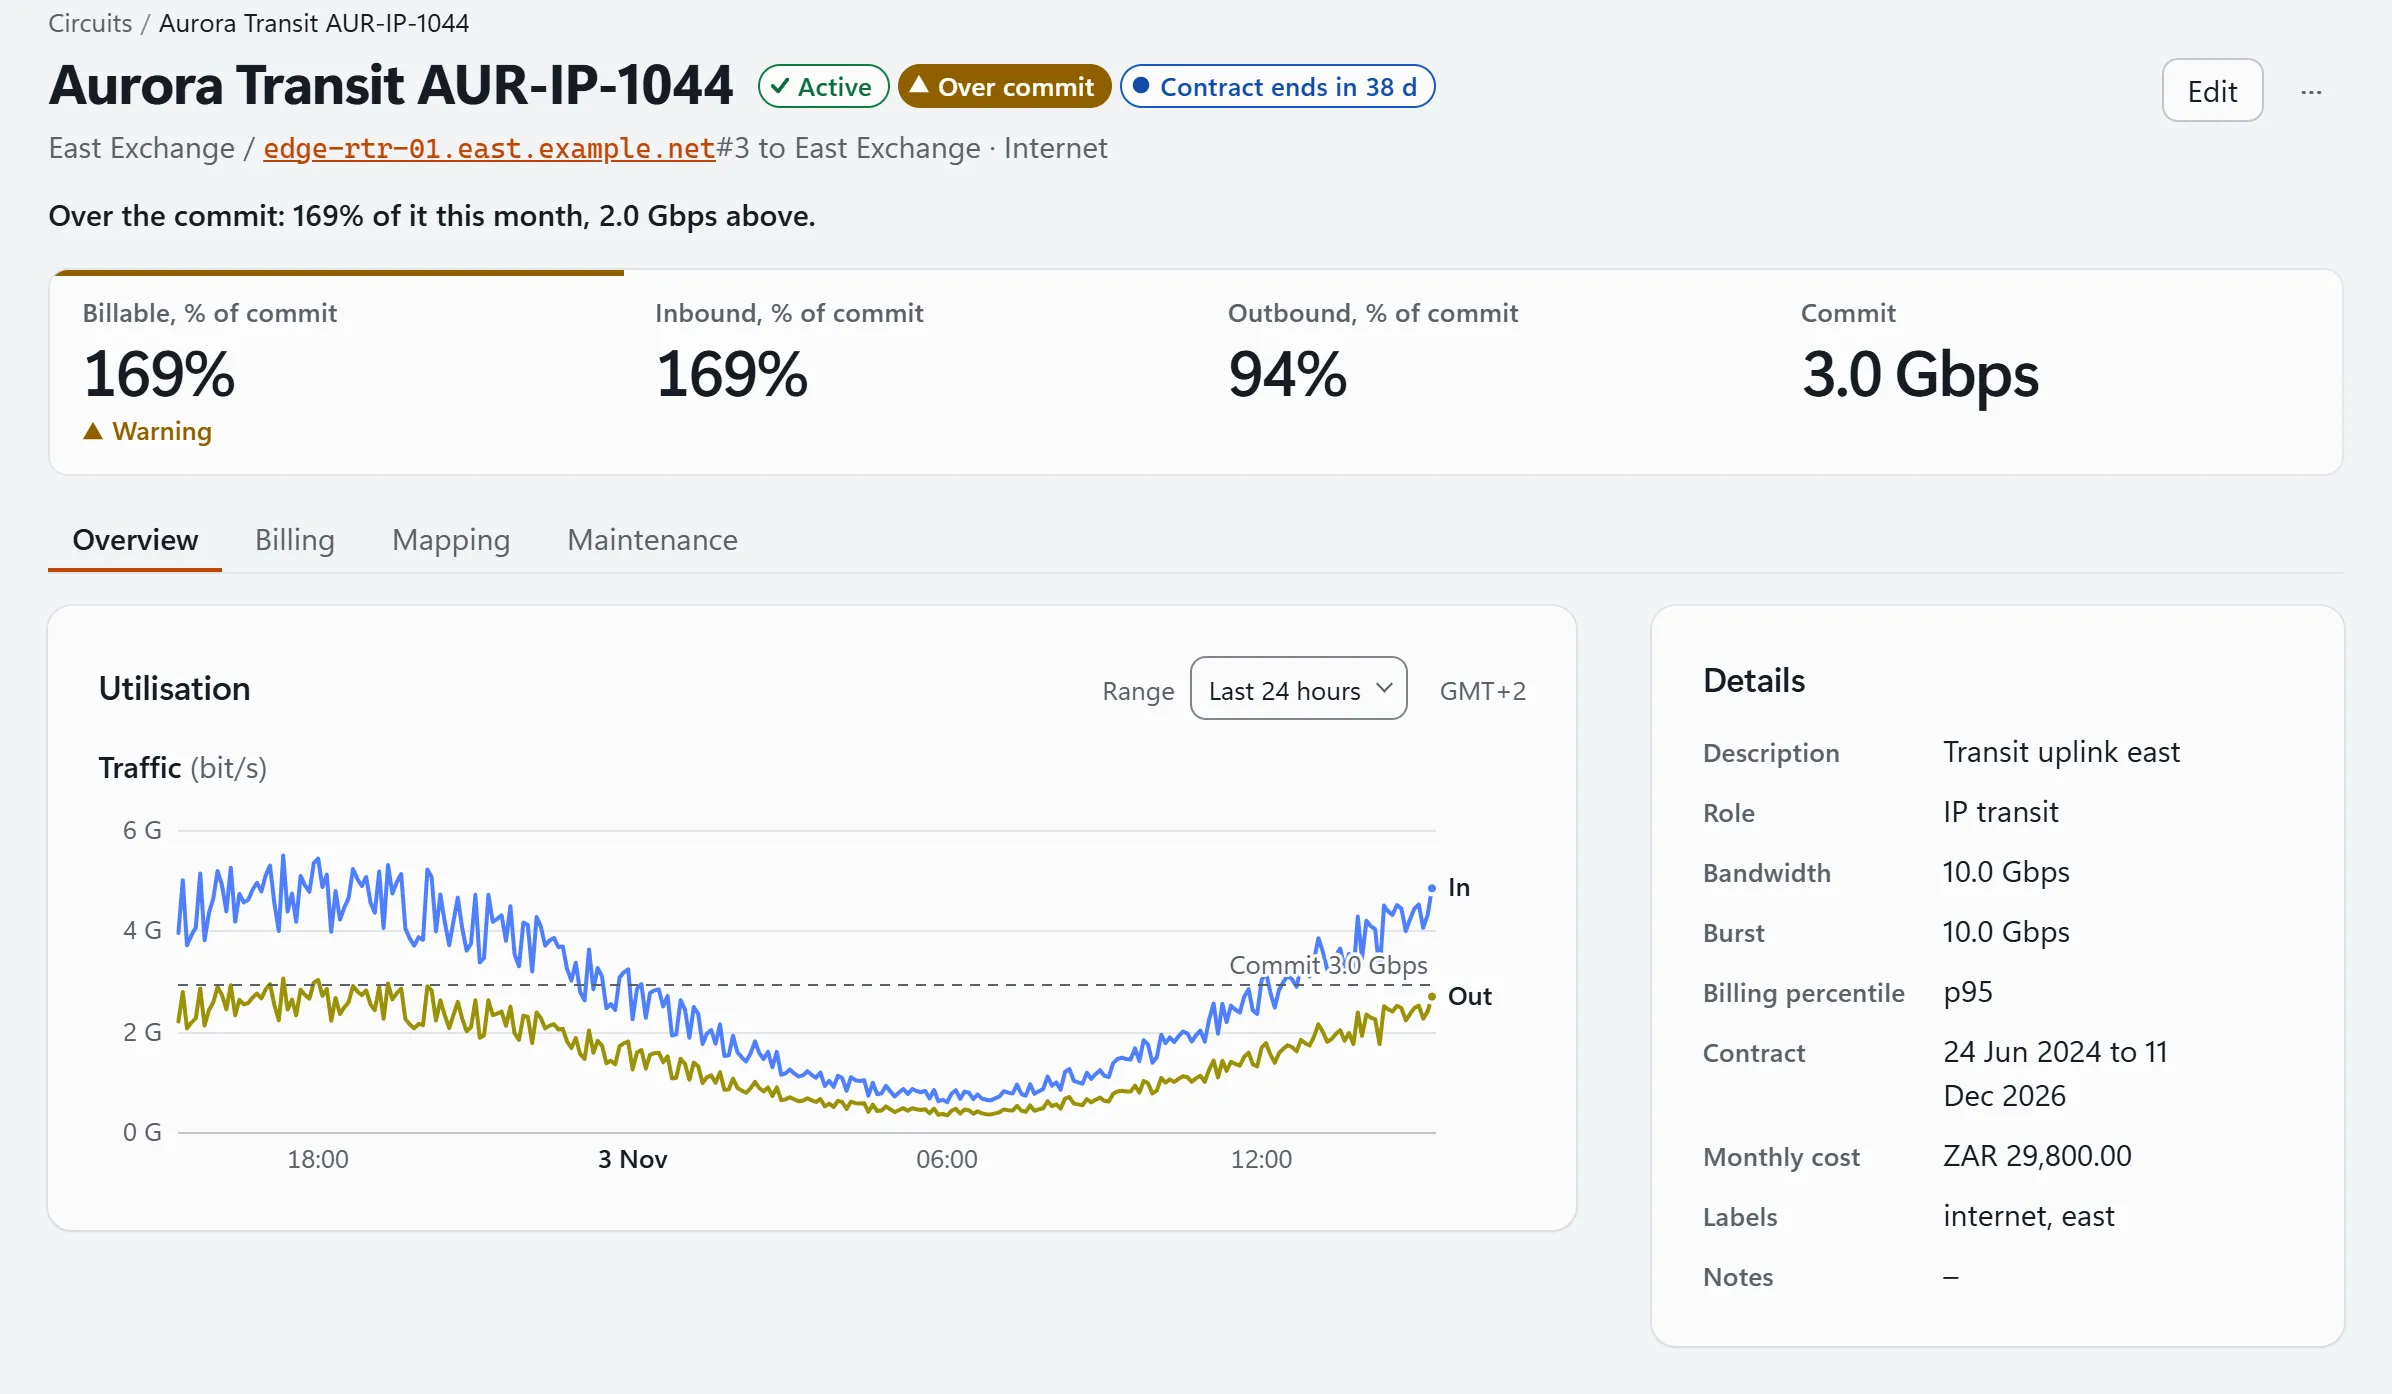
The Circuits module measures each circuit you buy from the interface it lands on, over SNMP rather than flow. Add the circuit with its committed rate, and FishEye shows the 95th percentile in and out for the month, the figure most carriers bill on: drop the busiest 5 percent of the month’s five-minute readings, and the highest one left is what you pay for.
An alert can tell you when a circuit stays above its commit, goes down, or nears the end of its contract, and a billing report lists every circuit for the month.
This is an estimate, not the invoice. Where the carrier’s meter sits and how it counts can make small differences.
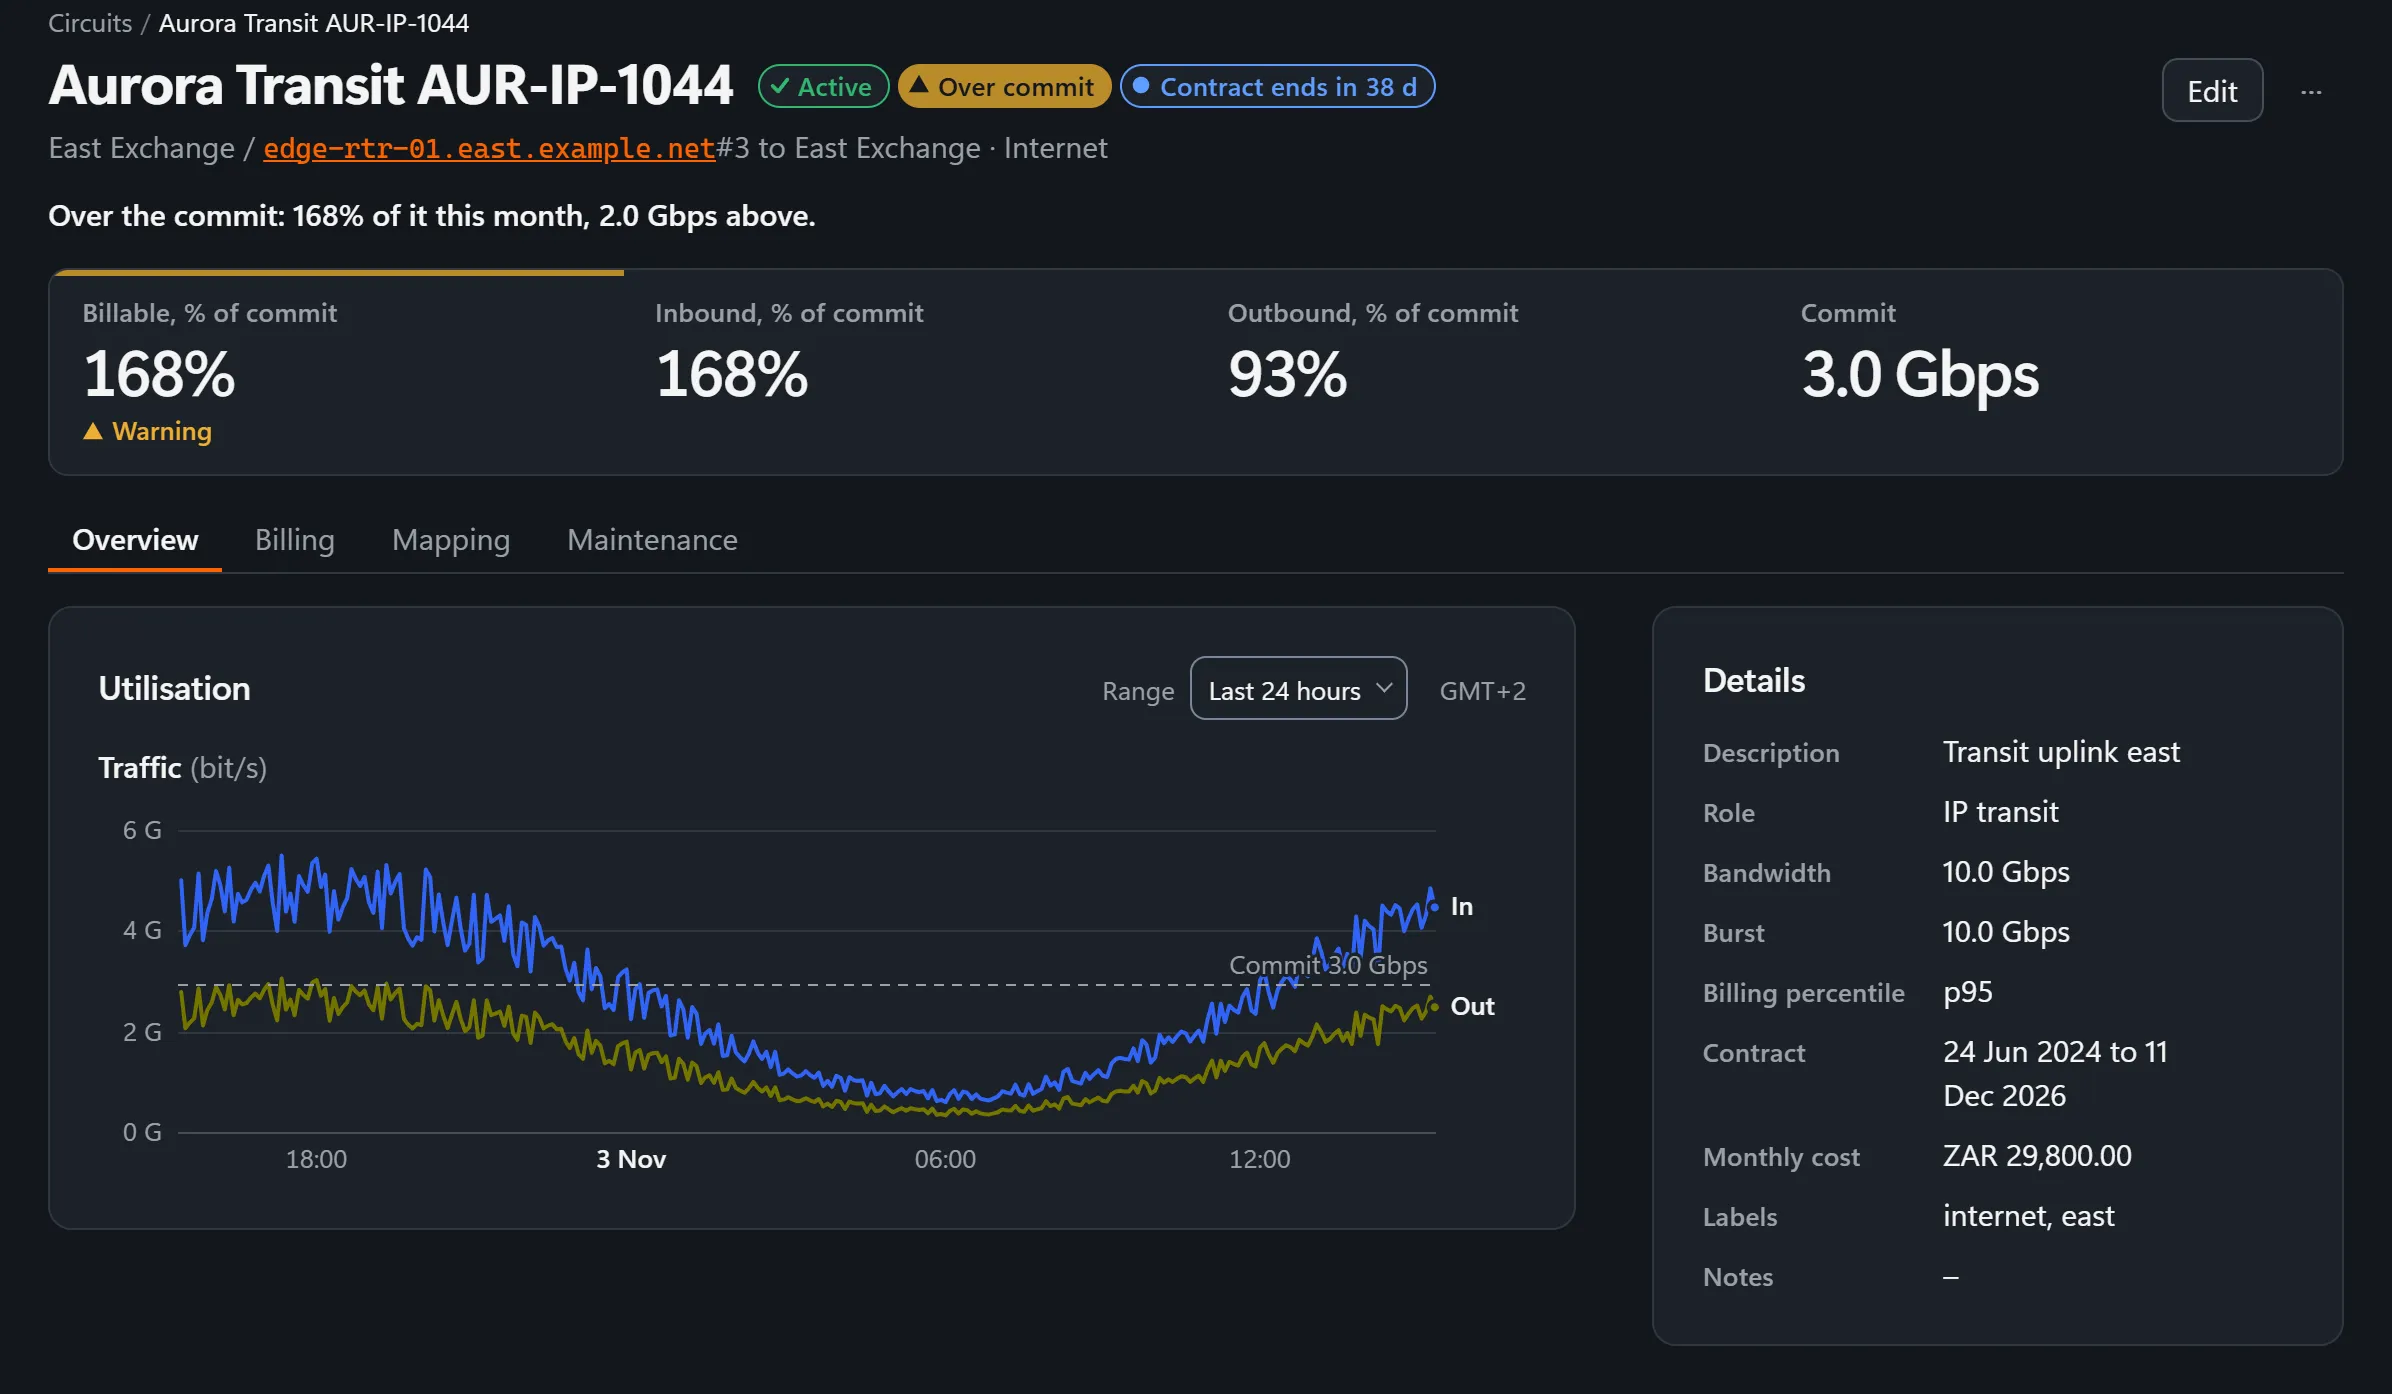
A made-up transit circuit running over its commit, billed at the 95th percentile.
Exporters
Know who is sending
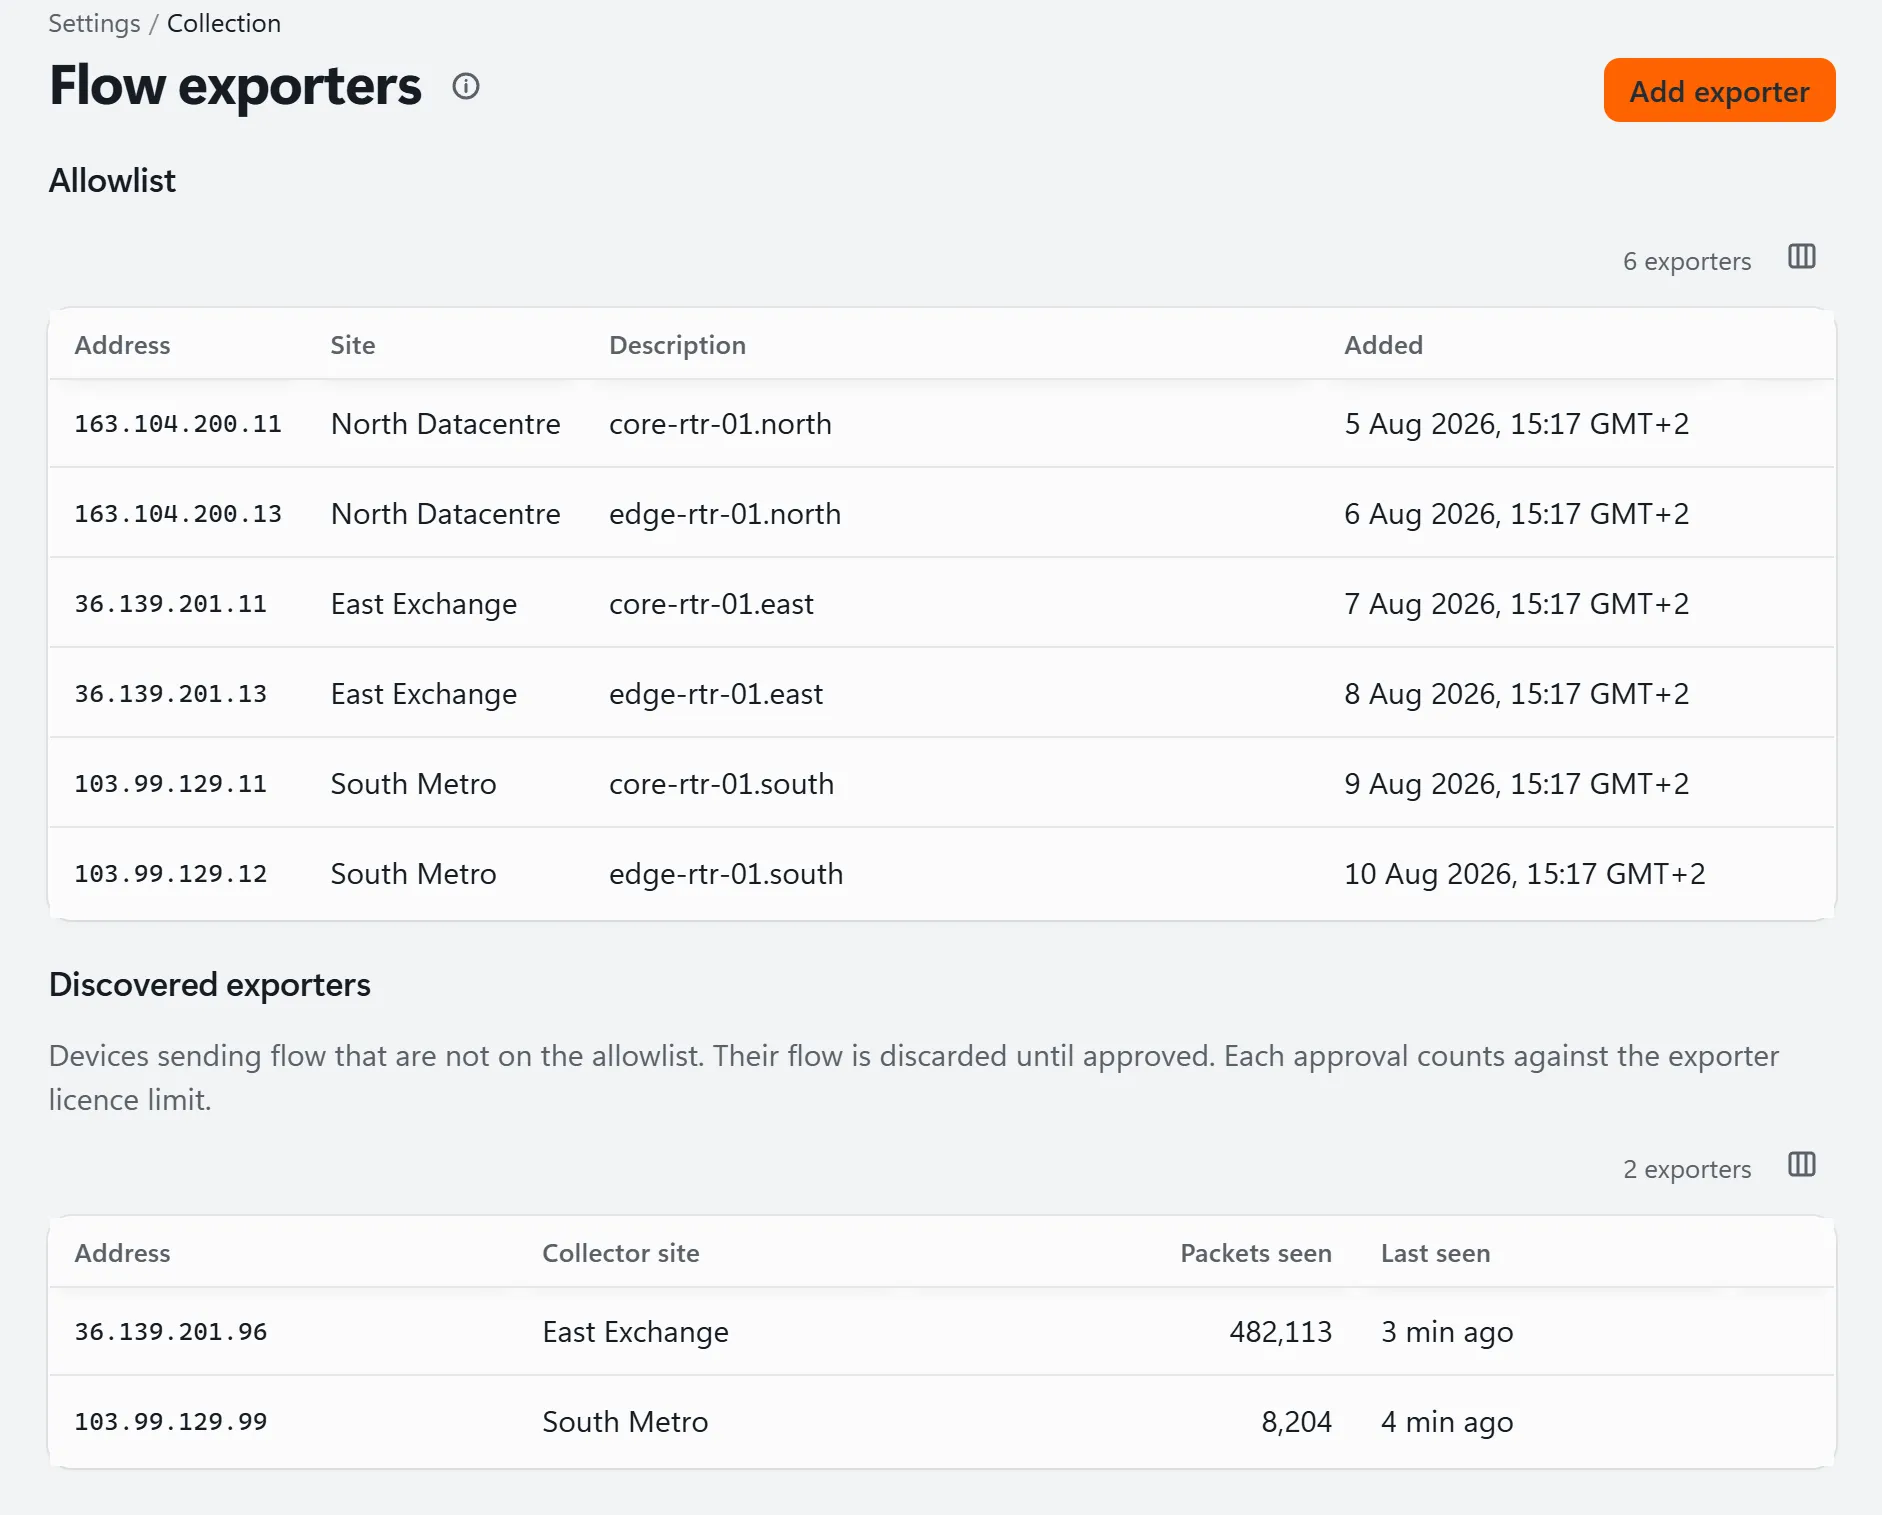
The exporters list shows every router that sent flow in the window, with its bytes, flows and when it was last seen. A sender FishEye does not know is dropped before its records are read, counted, and listed with its site, so you can approve it or leave it out.
Where a router says how it samples, FishEye scales the numbers up for you, so a sampled link still reads in real bytes.
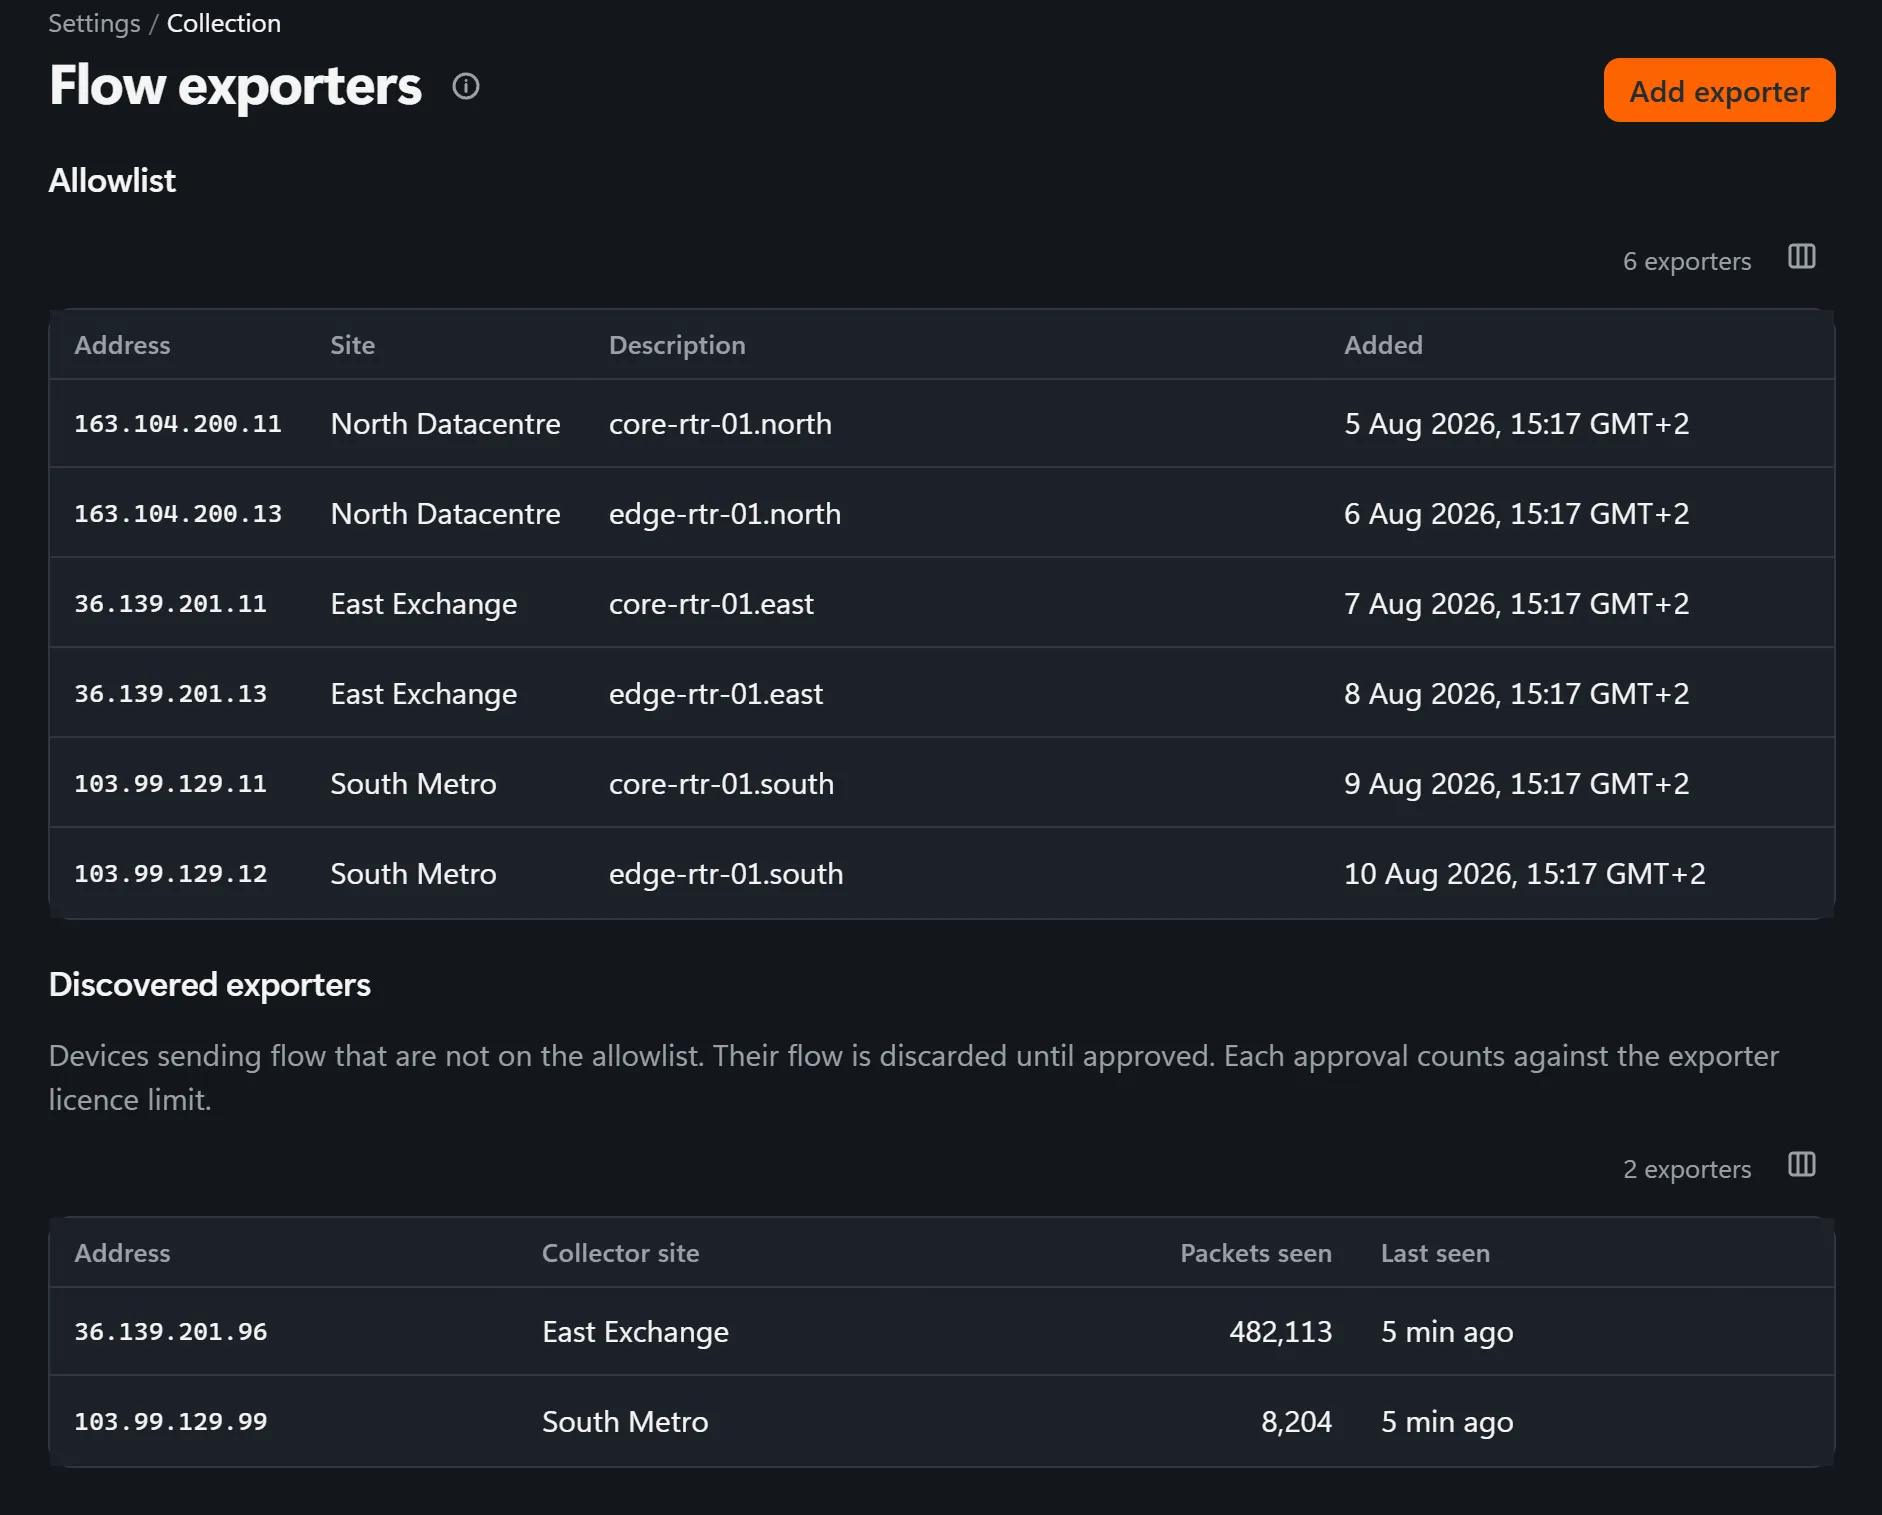
Two unknown senders, counted and waiting for someone to approve them.
Reports
Get the top talkers by email
A top-talkers report ranks the traffic of the last day, week or month by host, port, protocol, network or router, with a chart of the biggest. Run it when you need it, or schedule it daily, weekly or monthly and have it sent by email, as HTML, CSV or JSON.
Hosts and ports are kept in summaries for 7 days, so a monthly report ranks by protocol, network or router.
Who it is for
Anyone who has to explain a full link.
You start from a question and look. FishEye does not decide for you which traffic is a problem.
An ISP
A customer’s line is full: find which of their hosts did it, and talk to them. Before the transit invoice arrives, the Circuits module shows each circuit’s 95th percentile against its commit.
An enterprise
The office internet feels slow: see which machine and which service is using the link, and whether it was doing the same yesterday. Check it is not a backup that started in the wrong hour.
A data centre
A server is under load: see which sources send the most through its router, on which ports, and since when.
Capacity
How much can it take?
Tested at 80,000 flow records a second for two minutes, with every record stored. Beyond that, talk to us.
A flow record is the router’s summary of one conversation. That test ran on one 4-vCPU lab machine with generated traffic, shared with the traffic generator, not on a customer network.
FishEye reads NetFlow v5 and v9 and IPFIX, from any router that sends them. It tells the formats apart from the packet itself, so either port accepts any of them. It does not read sFlow.
For NetFlow v9 and IPFIX, set a short template refresh on the router, so FishEye can decode records again quickly after a restart.
What if my router samples?
Where the router puts its sampling rate in the export, FishEye scales bytes and packets up by it.
How long is flow data kept?
Every flow record for 3 days, one-minute summaries for 7 days, and hourly summaries for 400 days. A question about last month is answered from the hourly summaries, which keep protocols, networks, interfaces and routers but not hosts or ports.
Will it alert me to a DDoS by itself?
No. FishEye does not raise an alert from flow data. You investigate it yourself: notice the jump, see the protocol, find the source.
Does it change my routing?
No. FishEye only reads the flow records your routers send, and its collectors never write to a device. It needs no BGP session and never changes a route. It watches routing; it does not touch it.
Is it separate from the rest of FishEye?
It is an optional add-on, included from plan T3, and switched on by your licence. It uses FishEye’s collectors and its ClickHouse database, so it adds no server of its own.