
For the NOC

From the first alert to the fix.

An outage asks the team watching the network, the NOC (network operations centre), the same questions every time. Here is what FishEye shows for each one, and what to do next. Jump to the one you have.

A fault, step by step

The real FishEye console, recorded on a demo network: a target slows down, the problem lands on the NOC board, the path shows the hop where the round trip jumps, and the target recovers. Host names and addresses are made up.

Overview · Checks

Is it down, or just slow?

Many monitoring tools check once every 5 minutes, so a 40-second spike can fall between two checks and never show. FishEye checks every target every minute by default, five pings each time, and you can set a target to every 10 seconds when a short spike matters.
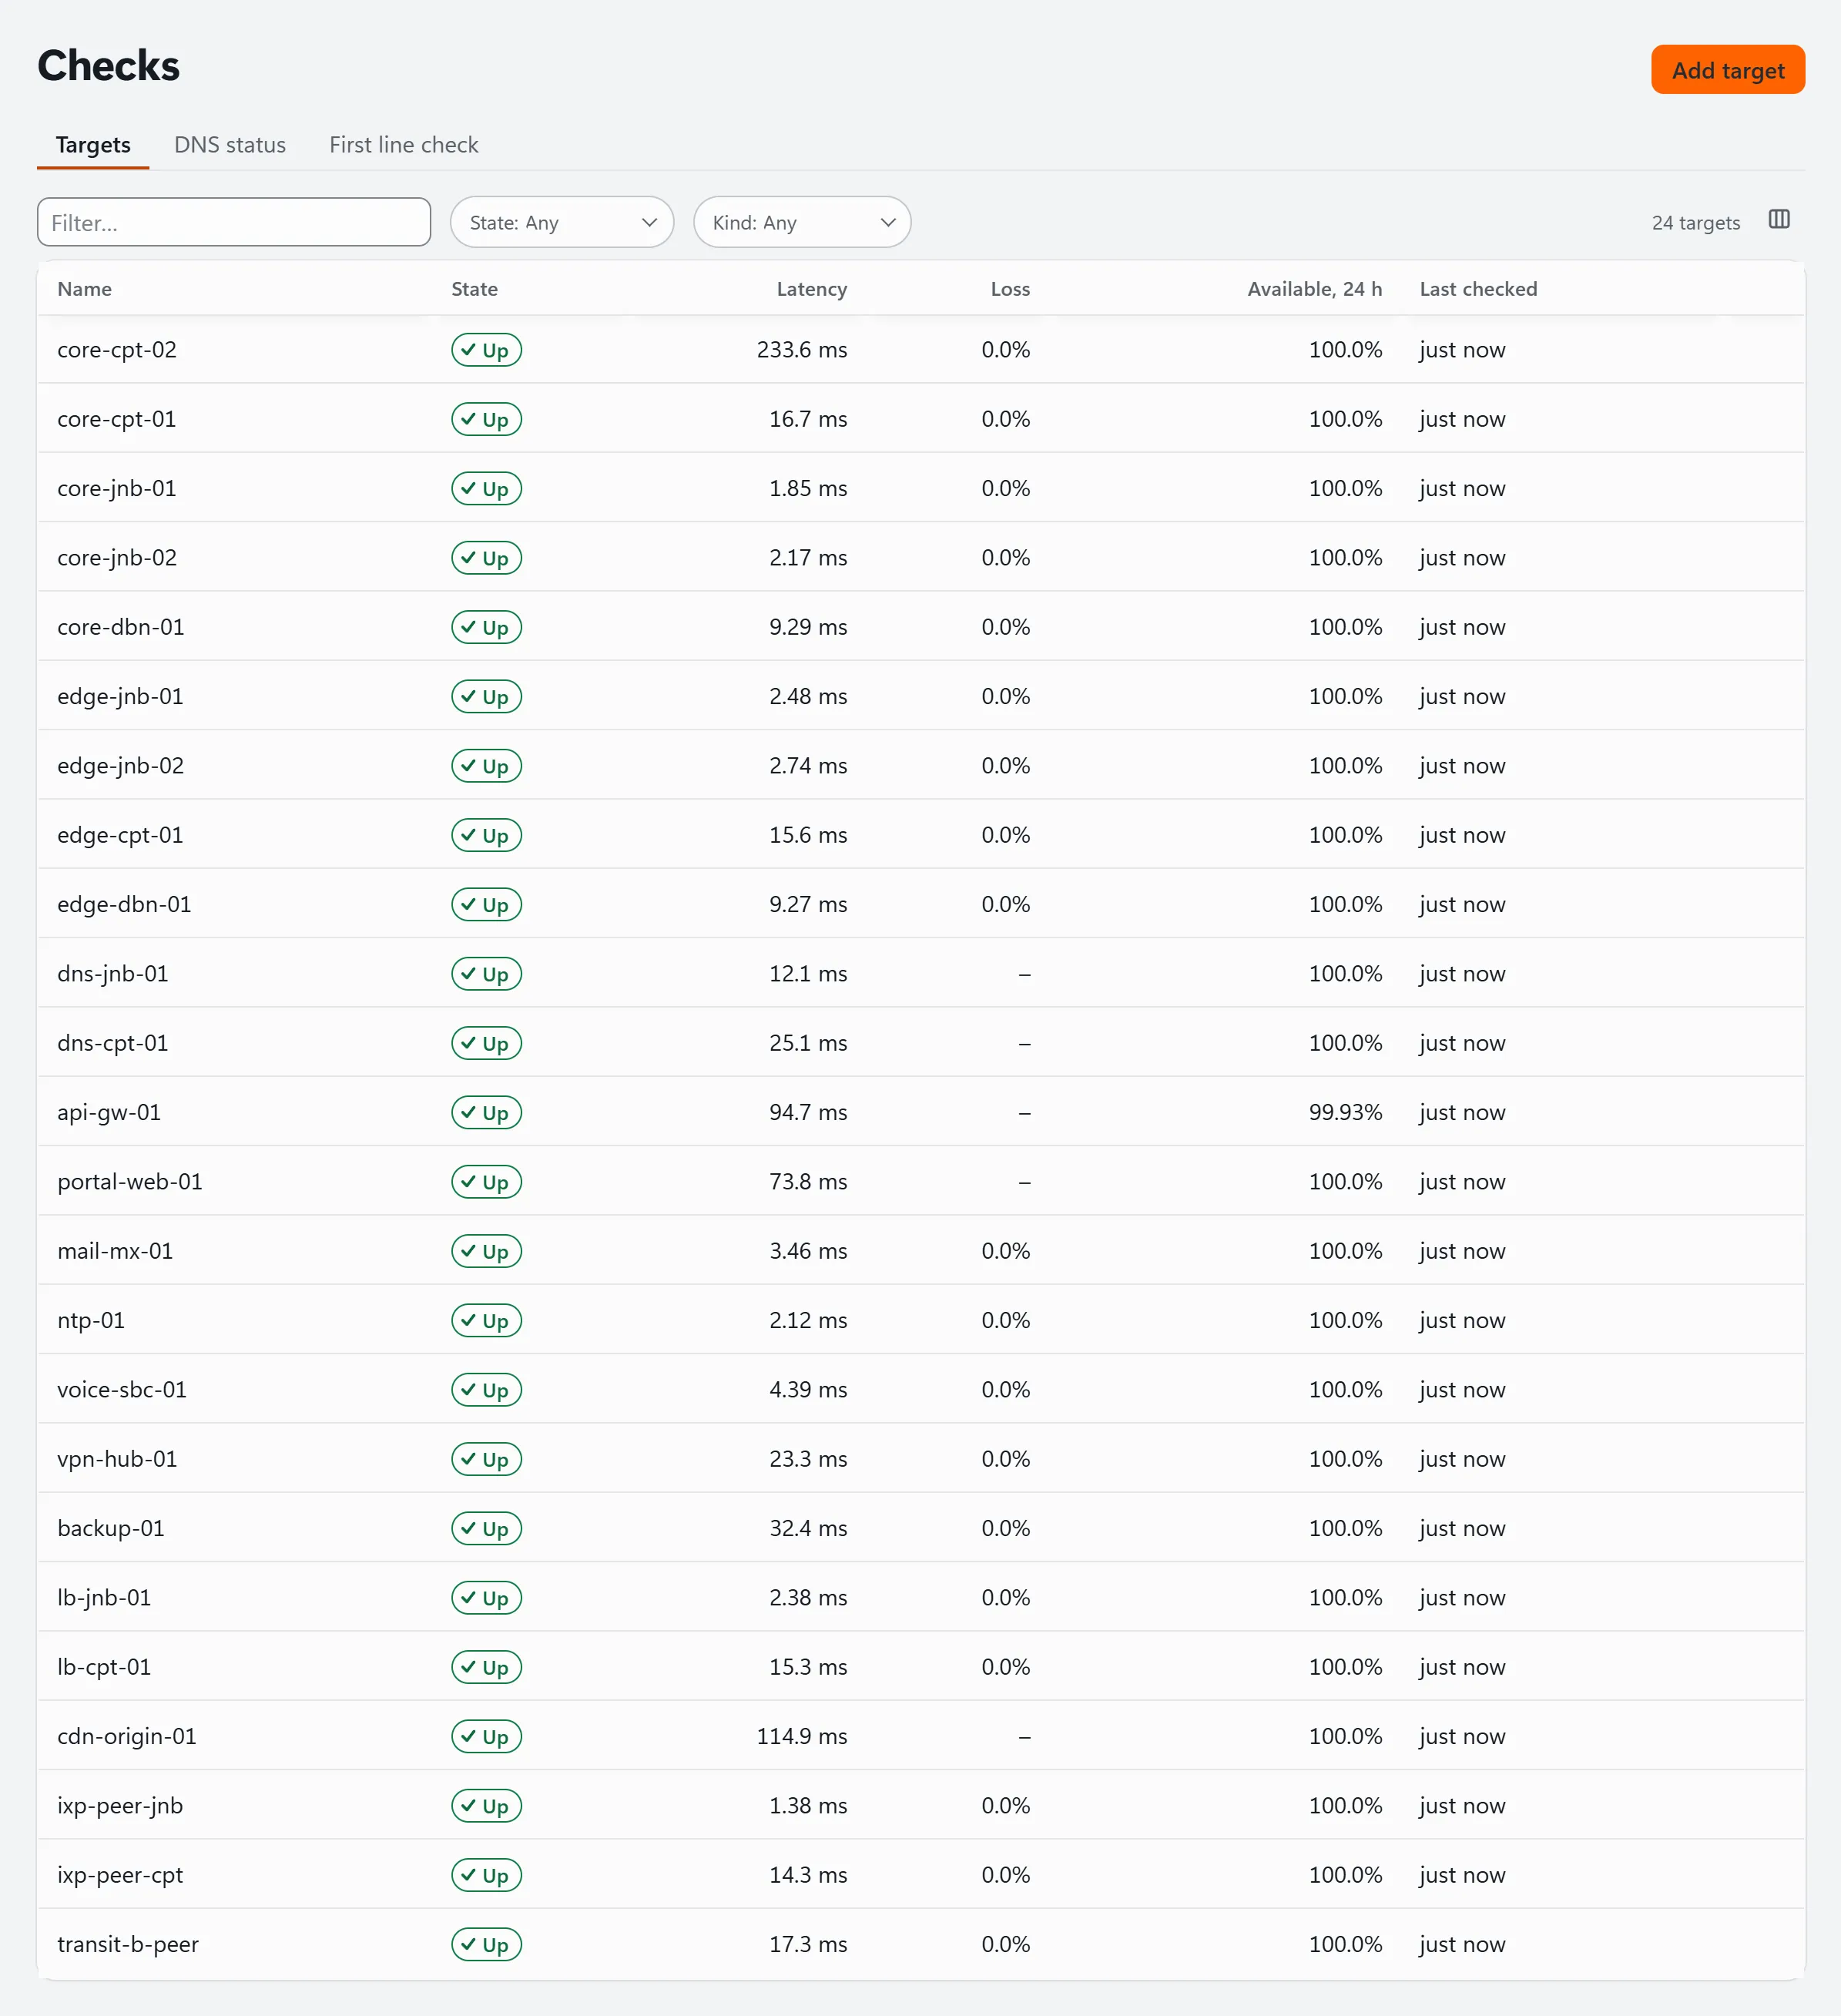
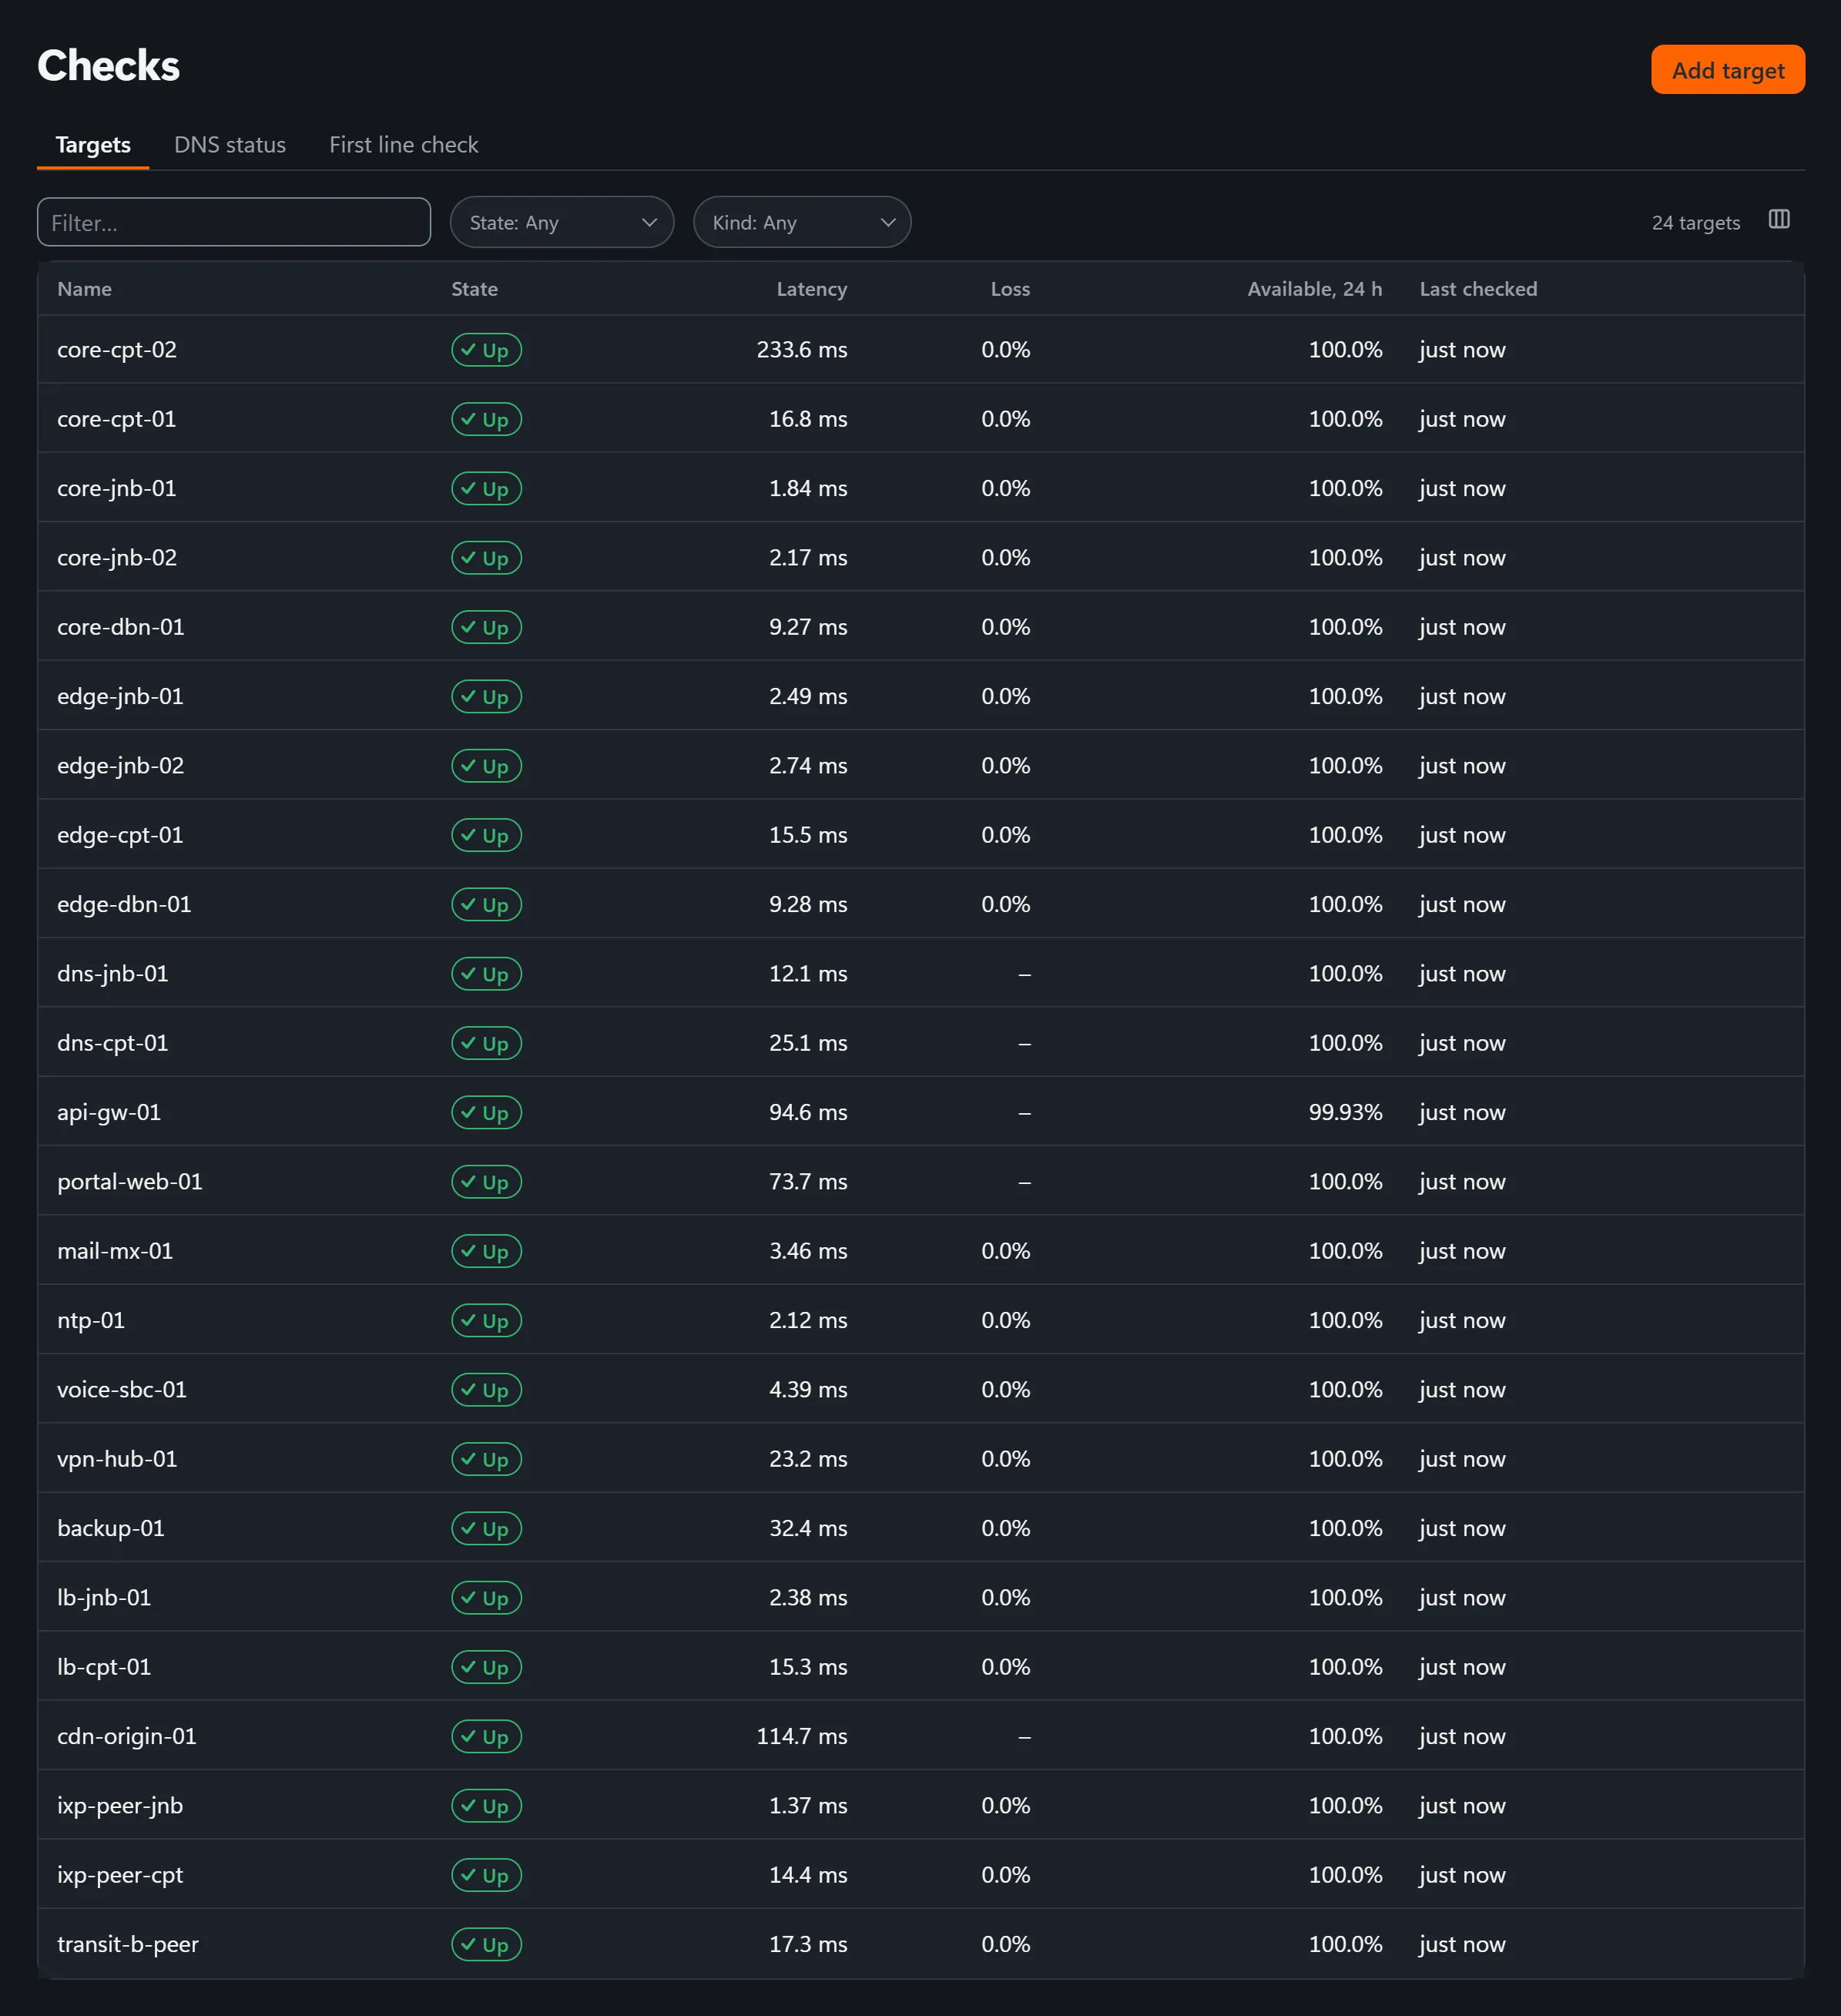
The checks list on a demo network: 24 targets, all up. core-cpt-02 answers in 233.6 ms; the others between 1.4 and 121 ms.The checks list on a demo network: 24 targets, all up. core-cpt-02 answers in 233.6 ms; the others between 1.4 and 121 ms.
Every target is up, but one answers in 233.6 ms. Demo network, made-up hosts.

What FishEye shows

  • Every target is up, down or unknown. It is up while any of its probes sees it answer, and down when the probes that are working see it fail.
  • A target whose probes have gone quiet reads unknown, with the reason, never down: a silent probe raises no outage and clears none.
  • Alert rules on packet loss, round-trip time or a failed check, with the thresholds you set. A rule opens a problem after 3 bad results in a row and clears it after 3 good ones, unless you change the counts.

What you do next

  • Open the target: its round-trip time, success rate and packet loss over the range you pick.
  • Check the customer’s services: a service is down only while every check and circuit it is made of is down, and degraded while some are.
Probes · Endpoints

Is it us, or the far end?

One vantage point cannot tell a local fault from a remote one. FishEye measures from several, and every result records where it was measured from.

What FishEye shows

  • Probes: small Linux agents at your other sites that run the ping, HTTP, DNS and traceroute checks you give them and dial out to the server. If the server is out of reach, a probe keeps its results on disk for up to 24 hours.
  • Endpoint agents on Windows and Linux computers: round trip and loss to the gateway and to FishEye, Wi-Fi signal, and HTTP and DNS checks to the services your users rely on, as the user’s machine sees them.
  • Each target’s state per probe, and a latency allowance per probe for a site whose link is known to be slower.

What you do next

  • Compare the probes: if all of them see the fault, look near the target; if one does, look at that probe’s site.
  • For a single user’s complaint, read their computer’s Wi-Fi and gateway before the core.

Checks · Path

Where on the path?

A traceroute lists every router between you and the target. FishEye runs one from each probe on the schedule you set for the target, as often as once a minute, keeps 90 days of them, and lets you scroll back through them.

What FishEye shows

  • Every hop with its loss and round trip, its network (its AS number, the number that identifies the operator), the owner and the location.
  • Loss and round trip of one hop over time, as charts, so you see when it started.
  • A mark on the time slider at each run whose path differs from the run before, and an optional path-change alert once a new path holds for 3 runs in a row.
  • Trace now from a chosen probe, or once from the server itself.

What you do next

  • Find the hop where loss or delay appears and stays for every hop after it: that network is where to ask.
  • Move the time slider back to the route before the change, and send the provider both.

More on the Path page

Traffic · Flow

What filled the link?

FishEye shows which hosts filled the link. The optional Flow add-on reads NetFlow (v5 and v9) and IPFIX, the traffic summaries your routers send of who talked to whom.

The real FishEye console, recorded on a demo network. Flow throughput jumps from about 1 Gbps to 9. Ranked by protocol it is mostly UDP; by source, one address sent three quarters of it; by destination, it is aimed at one host. FishEye does not flag a flood like this by itself: this is someone looking. Addresses are made up.

In our load test, one shared 4-vCPU lab machine stored every one of 80,000 flow records a second for two minutes, with generated traffic.

What FishEye shows

  • Throughput over any window you pick, for all routers or one.
  • The top 20 by source or destination address, port, protocol, network (AS), interface or router, with each one’s share of the bytes.
  • On a traffic map, what is on one link: the top talkers across that interface, in each direction.
  • A scheduled top-talkers report, sent by email.

What you do next

  • Name the transfer that filled the link, and talk to whoever owns it.
  • If you find one unknown source sending to one host, take the address to your upstream to filter it.
  • See whether it is a one-off or a pattern before you buy more capacity.

More on the Flow page

Devices · Inventory

Is the hardware failing?

Any router or switch that answers SNMP v2c or v3 works for interfaces and inventory. A collector at the site polls it every minute by default, and never writes to it.

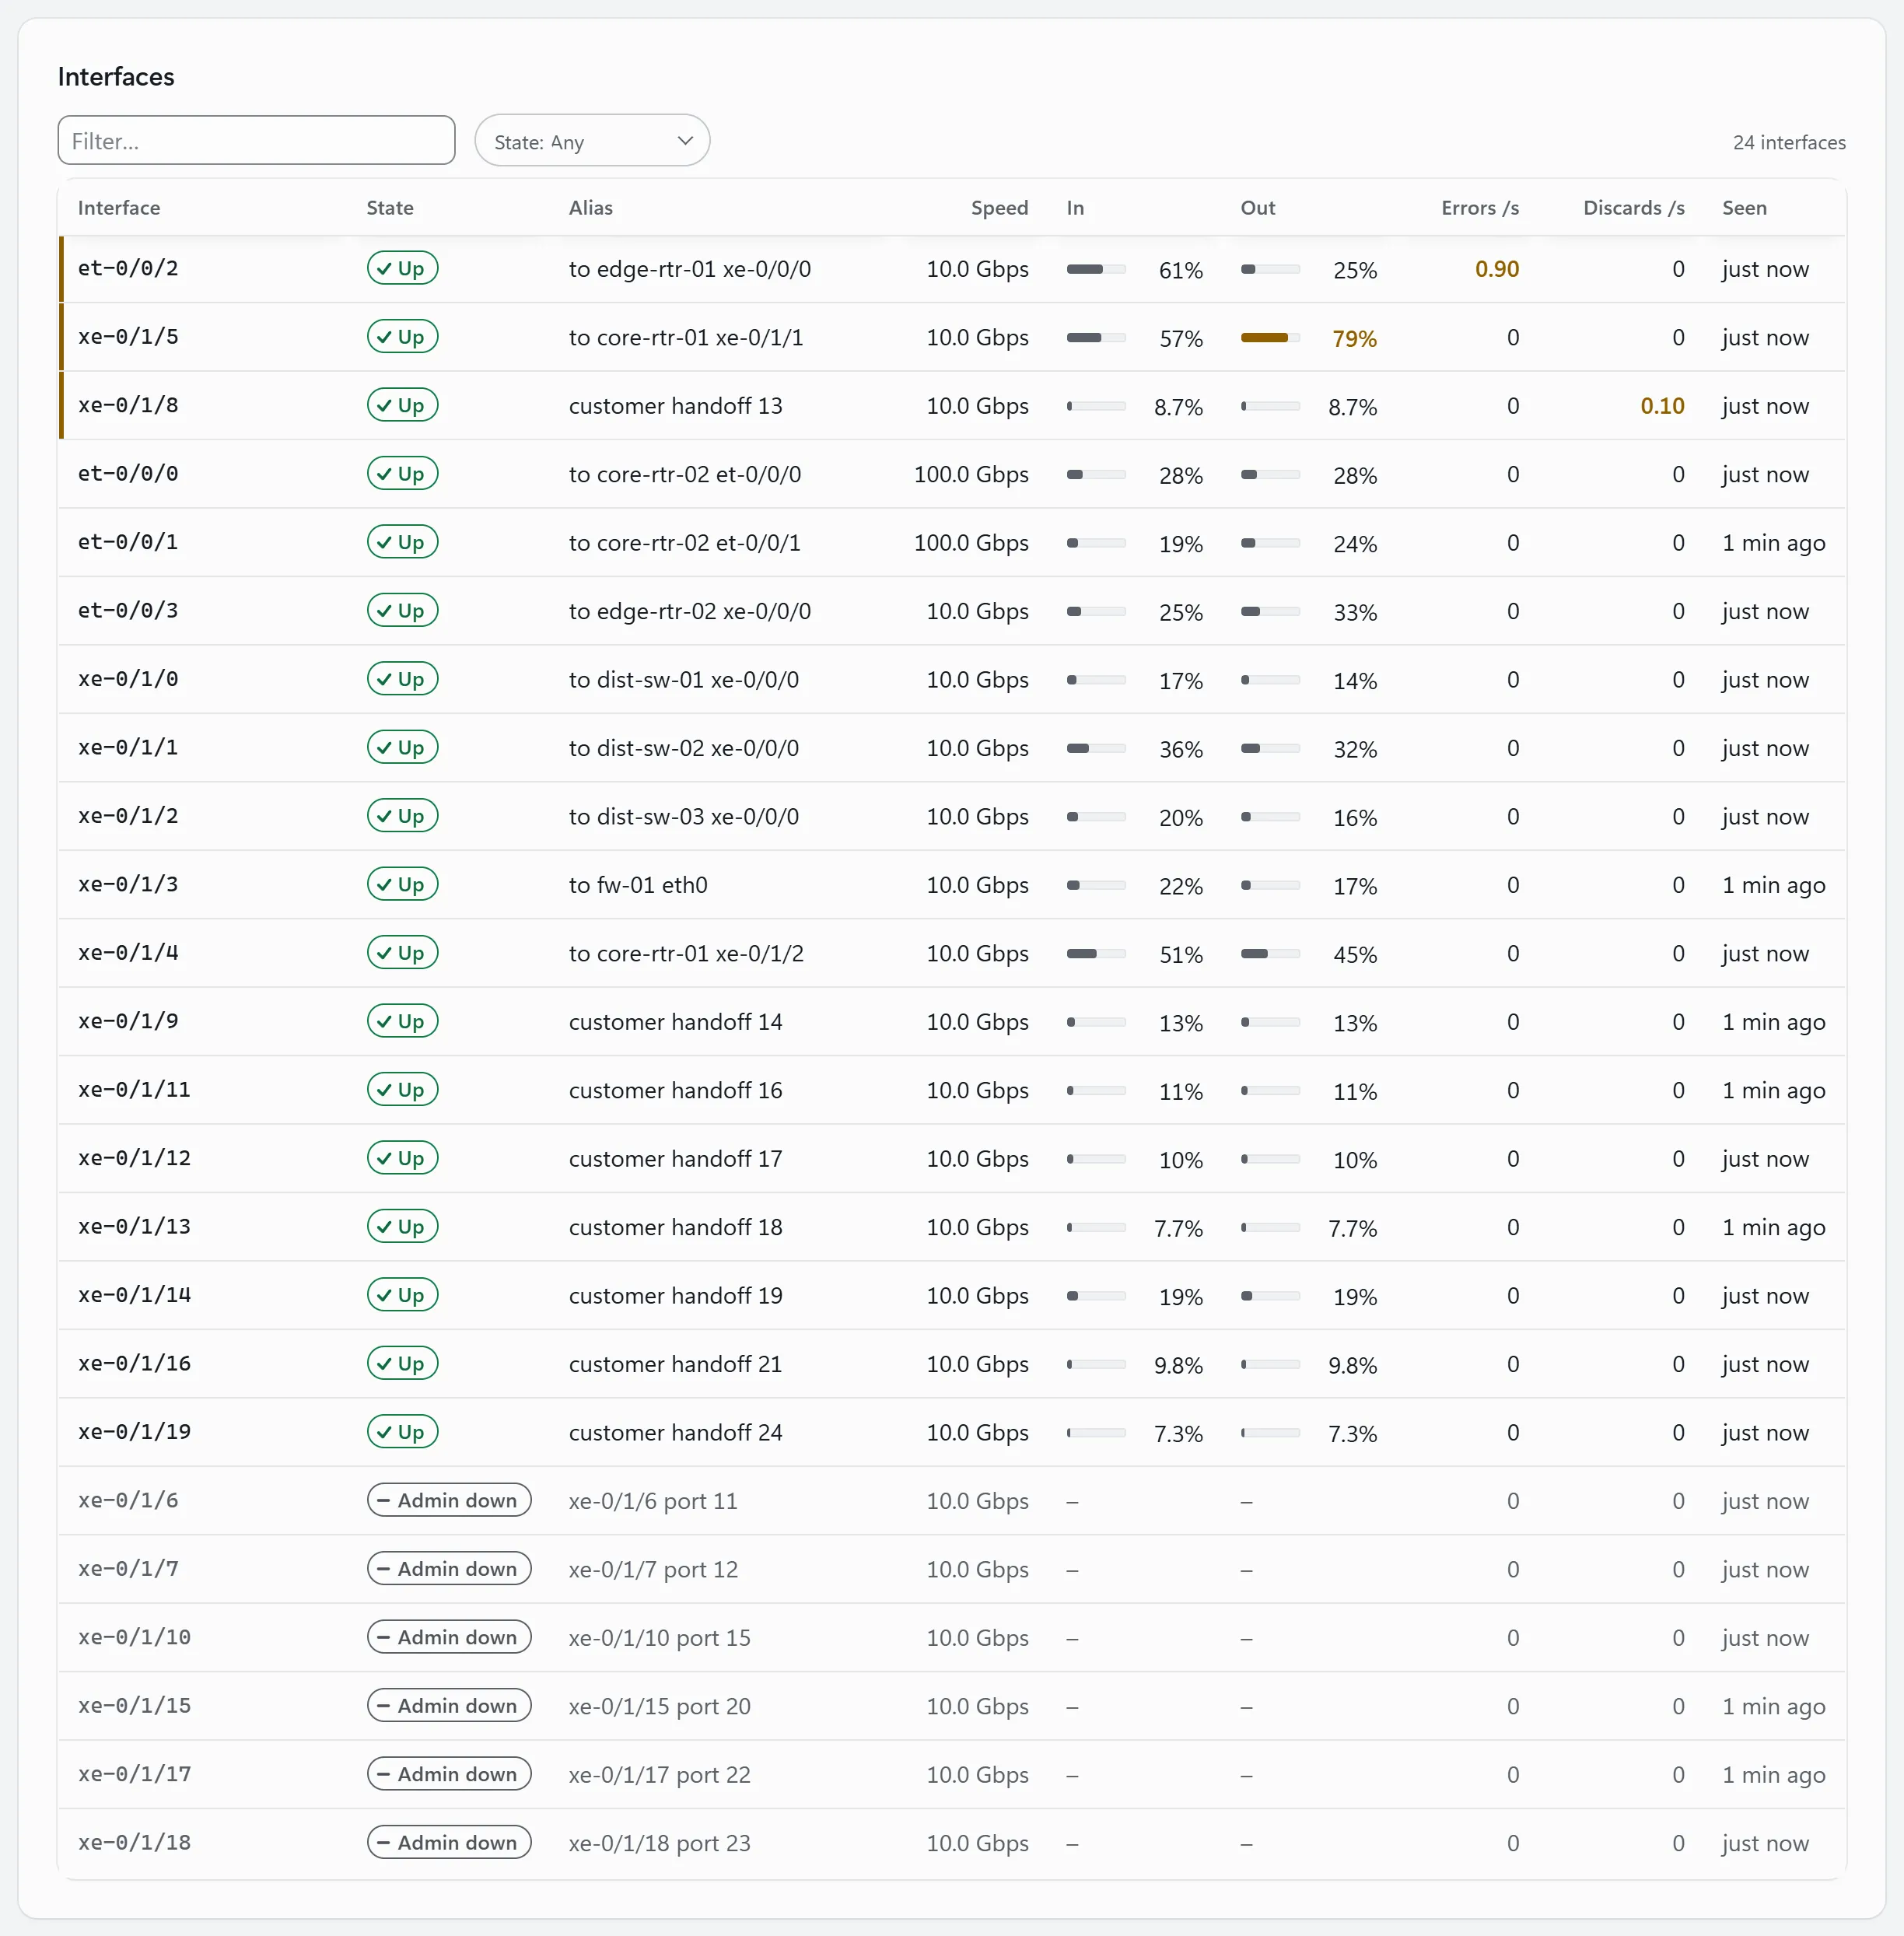
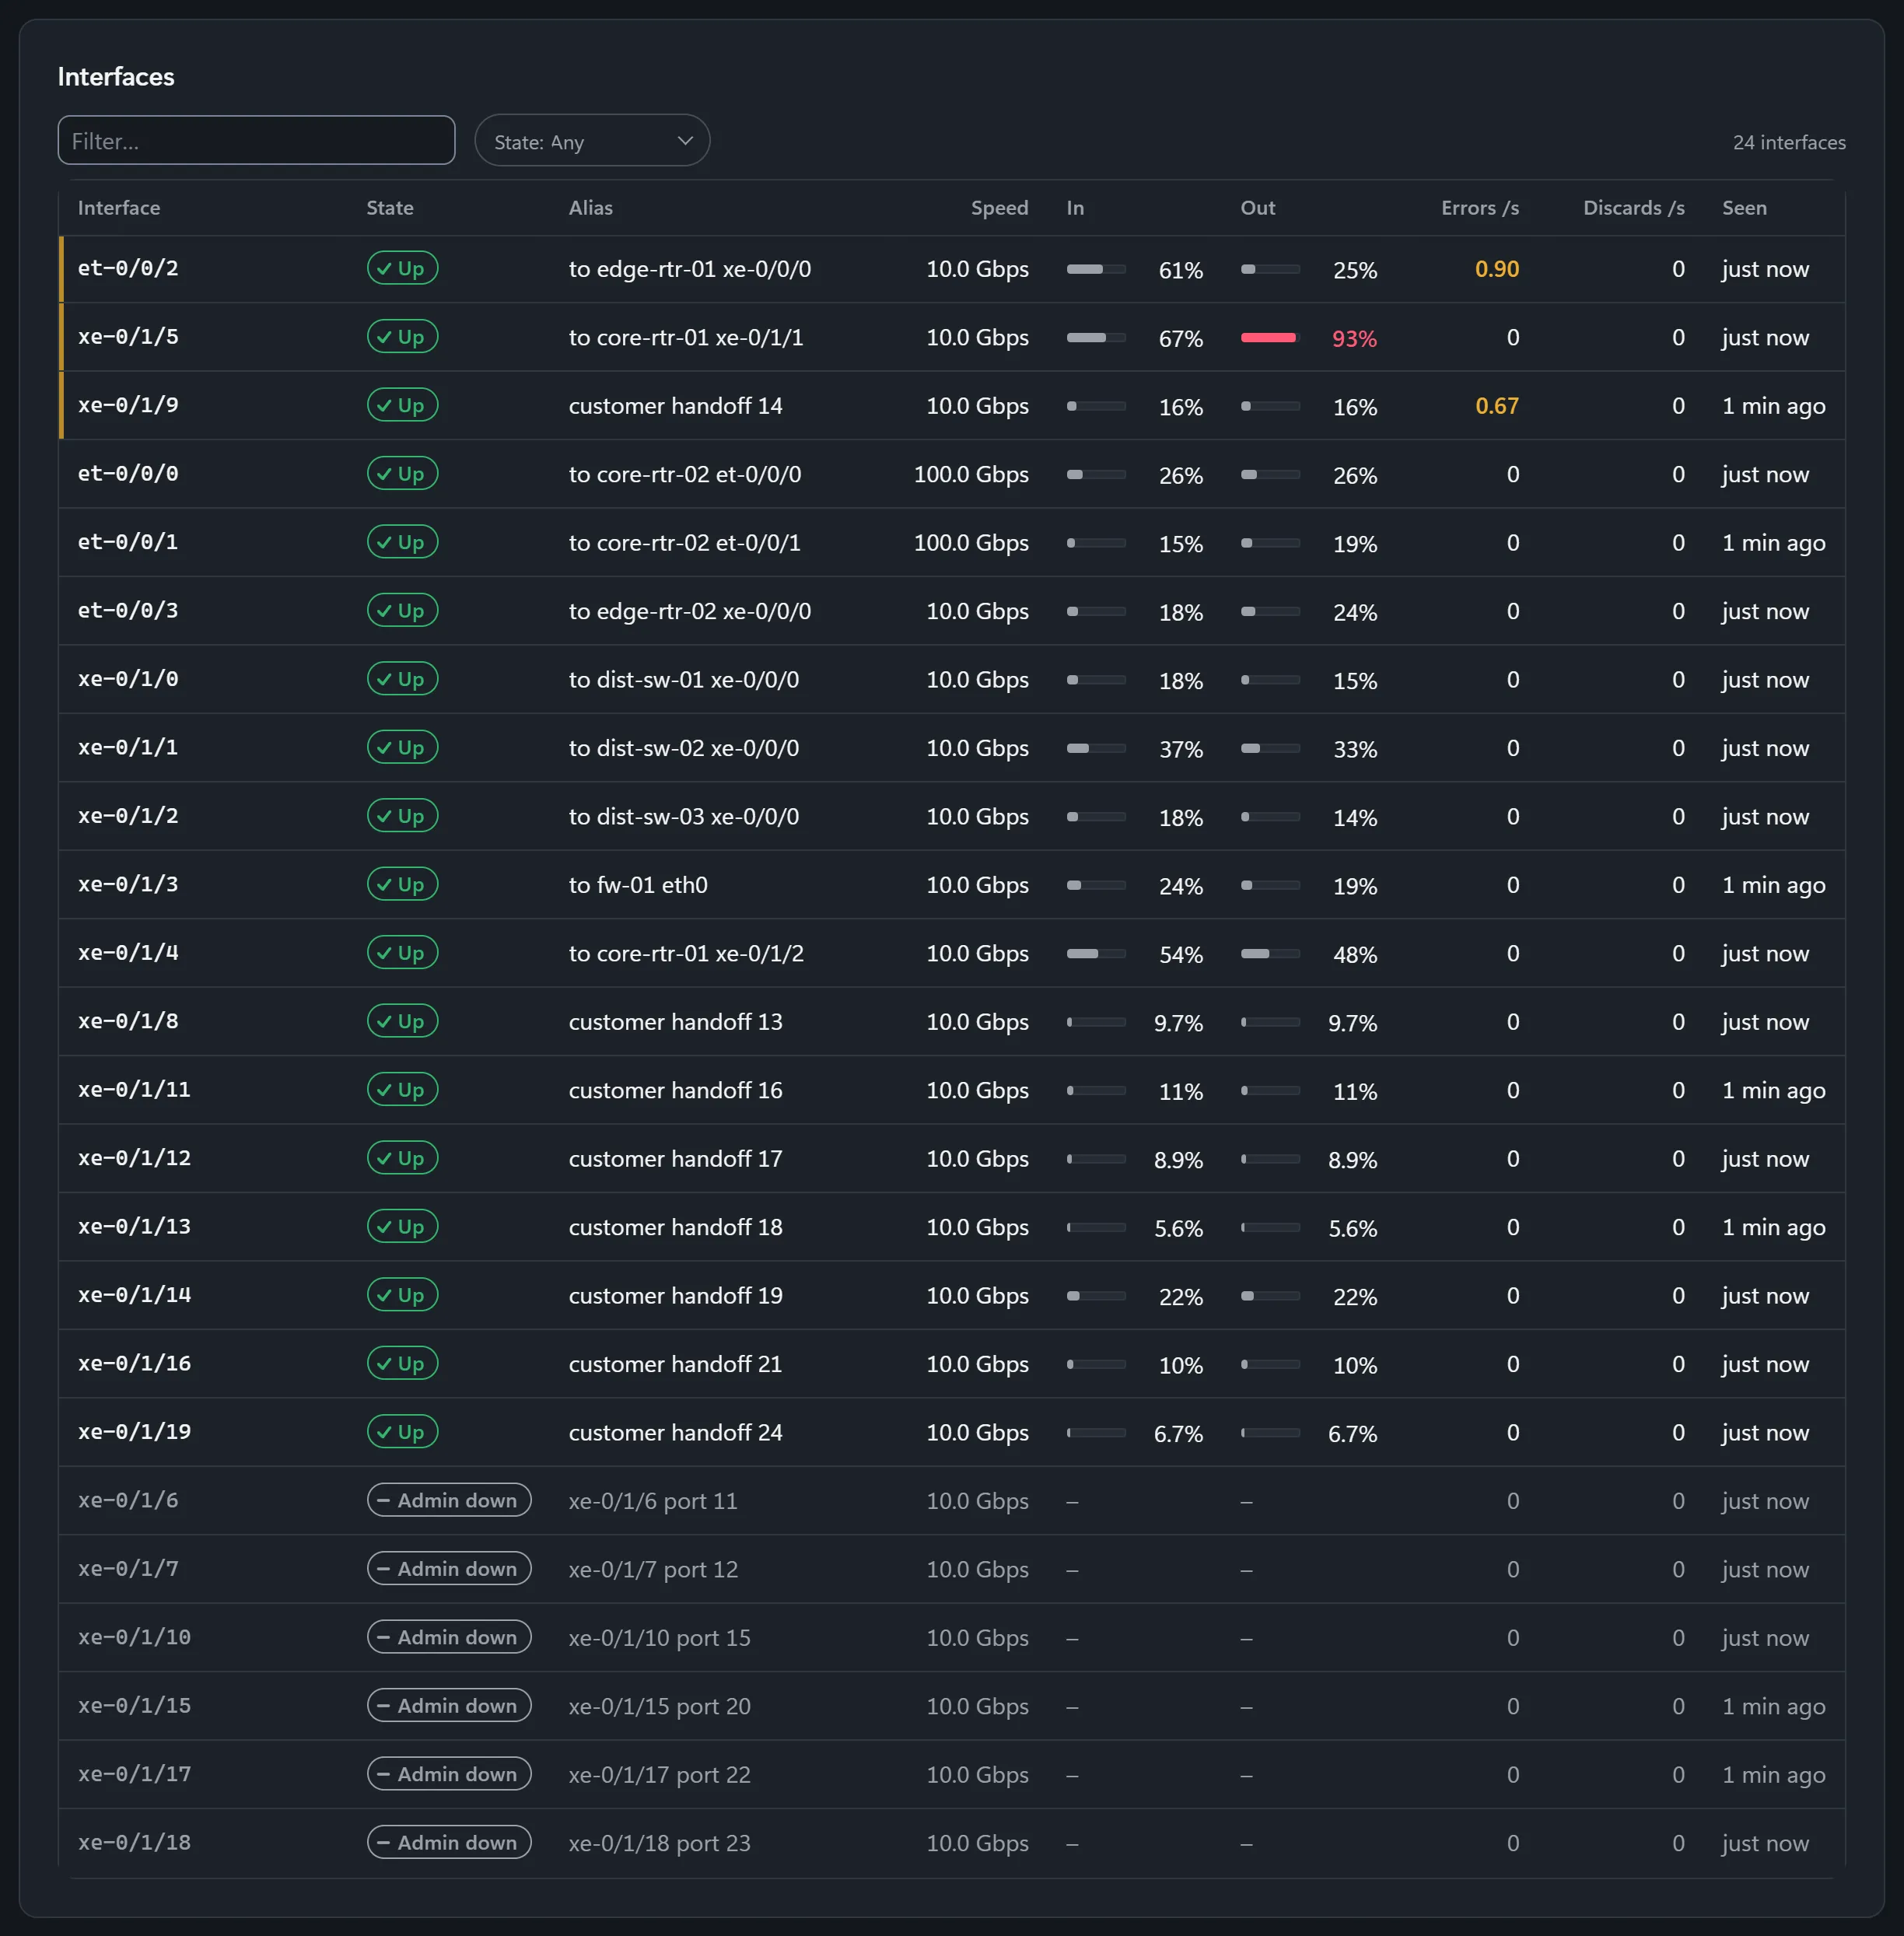
The interfaces table of a demo core router: 24 ports with speed, traffic in and out, and errors and discards a second. The 10 Gbps uplink et-0/0/2 runs at 61 percent inbound with 0.90 errors a second.The interfaces table of a demo core router: 24 ports with speed, traffic in and out, and errors and discards a second. The 10 Gbps uplink et-0/0/2 runs at 61 percent inbound with 0.90 errors a second.
Errors on one uplink while the other ports are clean. Demo device, made-up data.

What FishEye shows

  • Traffic, errors, discards and state for every interface it finds, on any SNMP device, with alerts for an interface that goes down or runs too full.
  • Inventory: vendor, model, serial numbers, modules and software version, and an alert when a part is removed or replaced or the version changes.
  • SNMP traps (v1, v2c and v3) and syslog from your devices, with alerts on link down, BGP down, restarts or any trap or message you match.
  • The state of MPLS paths (LSPs, the pre-set routes carriers use across their core), read over SNMP from the router where each one starts.
  • With the gNMI module, interface counters every 10 seconds, CPU, memory and the state of each BGP session, streamed by devices that support it.

What you do next

  • Watch errors climb on a port and plan the fix in a maintenance window, not in an outage.
  • When a BGP session drops, see when it stopped working and with which neighbour.

Checks · DNS status

Is it DNS, or the web application?

Reachability is not the whole story. FishEye checks the services that ride on it.

What FishEye shows

  • DNS checks (name lookups) against a resolver you choose: ok, degraded when the answer is slower than you set, or down when there is no good answer. NXDOMAIN (“no such name”) counts as down. The DNS alert opens after 3 failures in a row.
  • HTTP checks of a web address, with the status code you expect, from each probe that runs them.
  • Path MTU checks: the biggest packet that crosses the path in one piece, and a warning for a black hole, where large packets vanish while pings still work.

What you do next

  • If DNS fails while ping is healthy, the network is fine: take it to whoever runs the resolver.
  • An HTTP failure on a host that answers ping goes to the application team, with the time it started.

Checks · First line check

What does the first check show?

First Line Check runs the checks a NOC would run by hand on one target, from several probes at once, and puts the answers in one report.

What FishEye shows

  • Ping, a name lookup, and an HTTP or TCP check from the target’s probes, with the latest polled state of its interfaces and its alerts from the last day.
  • The report has its own link, so it can go into a ticket. It reads only: probes run fixed checks and refuse any host that is not one of their own targets.

What you do next

  • If every probe fails to reach it and its interface is down, send someone to site; if only one probe fails, look at that probe’s path.

Problems · NOC board

Who needs to know?

One place for every open problem, and a way to tell the right people.

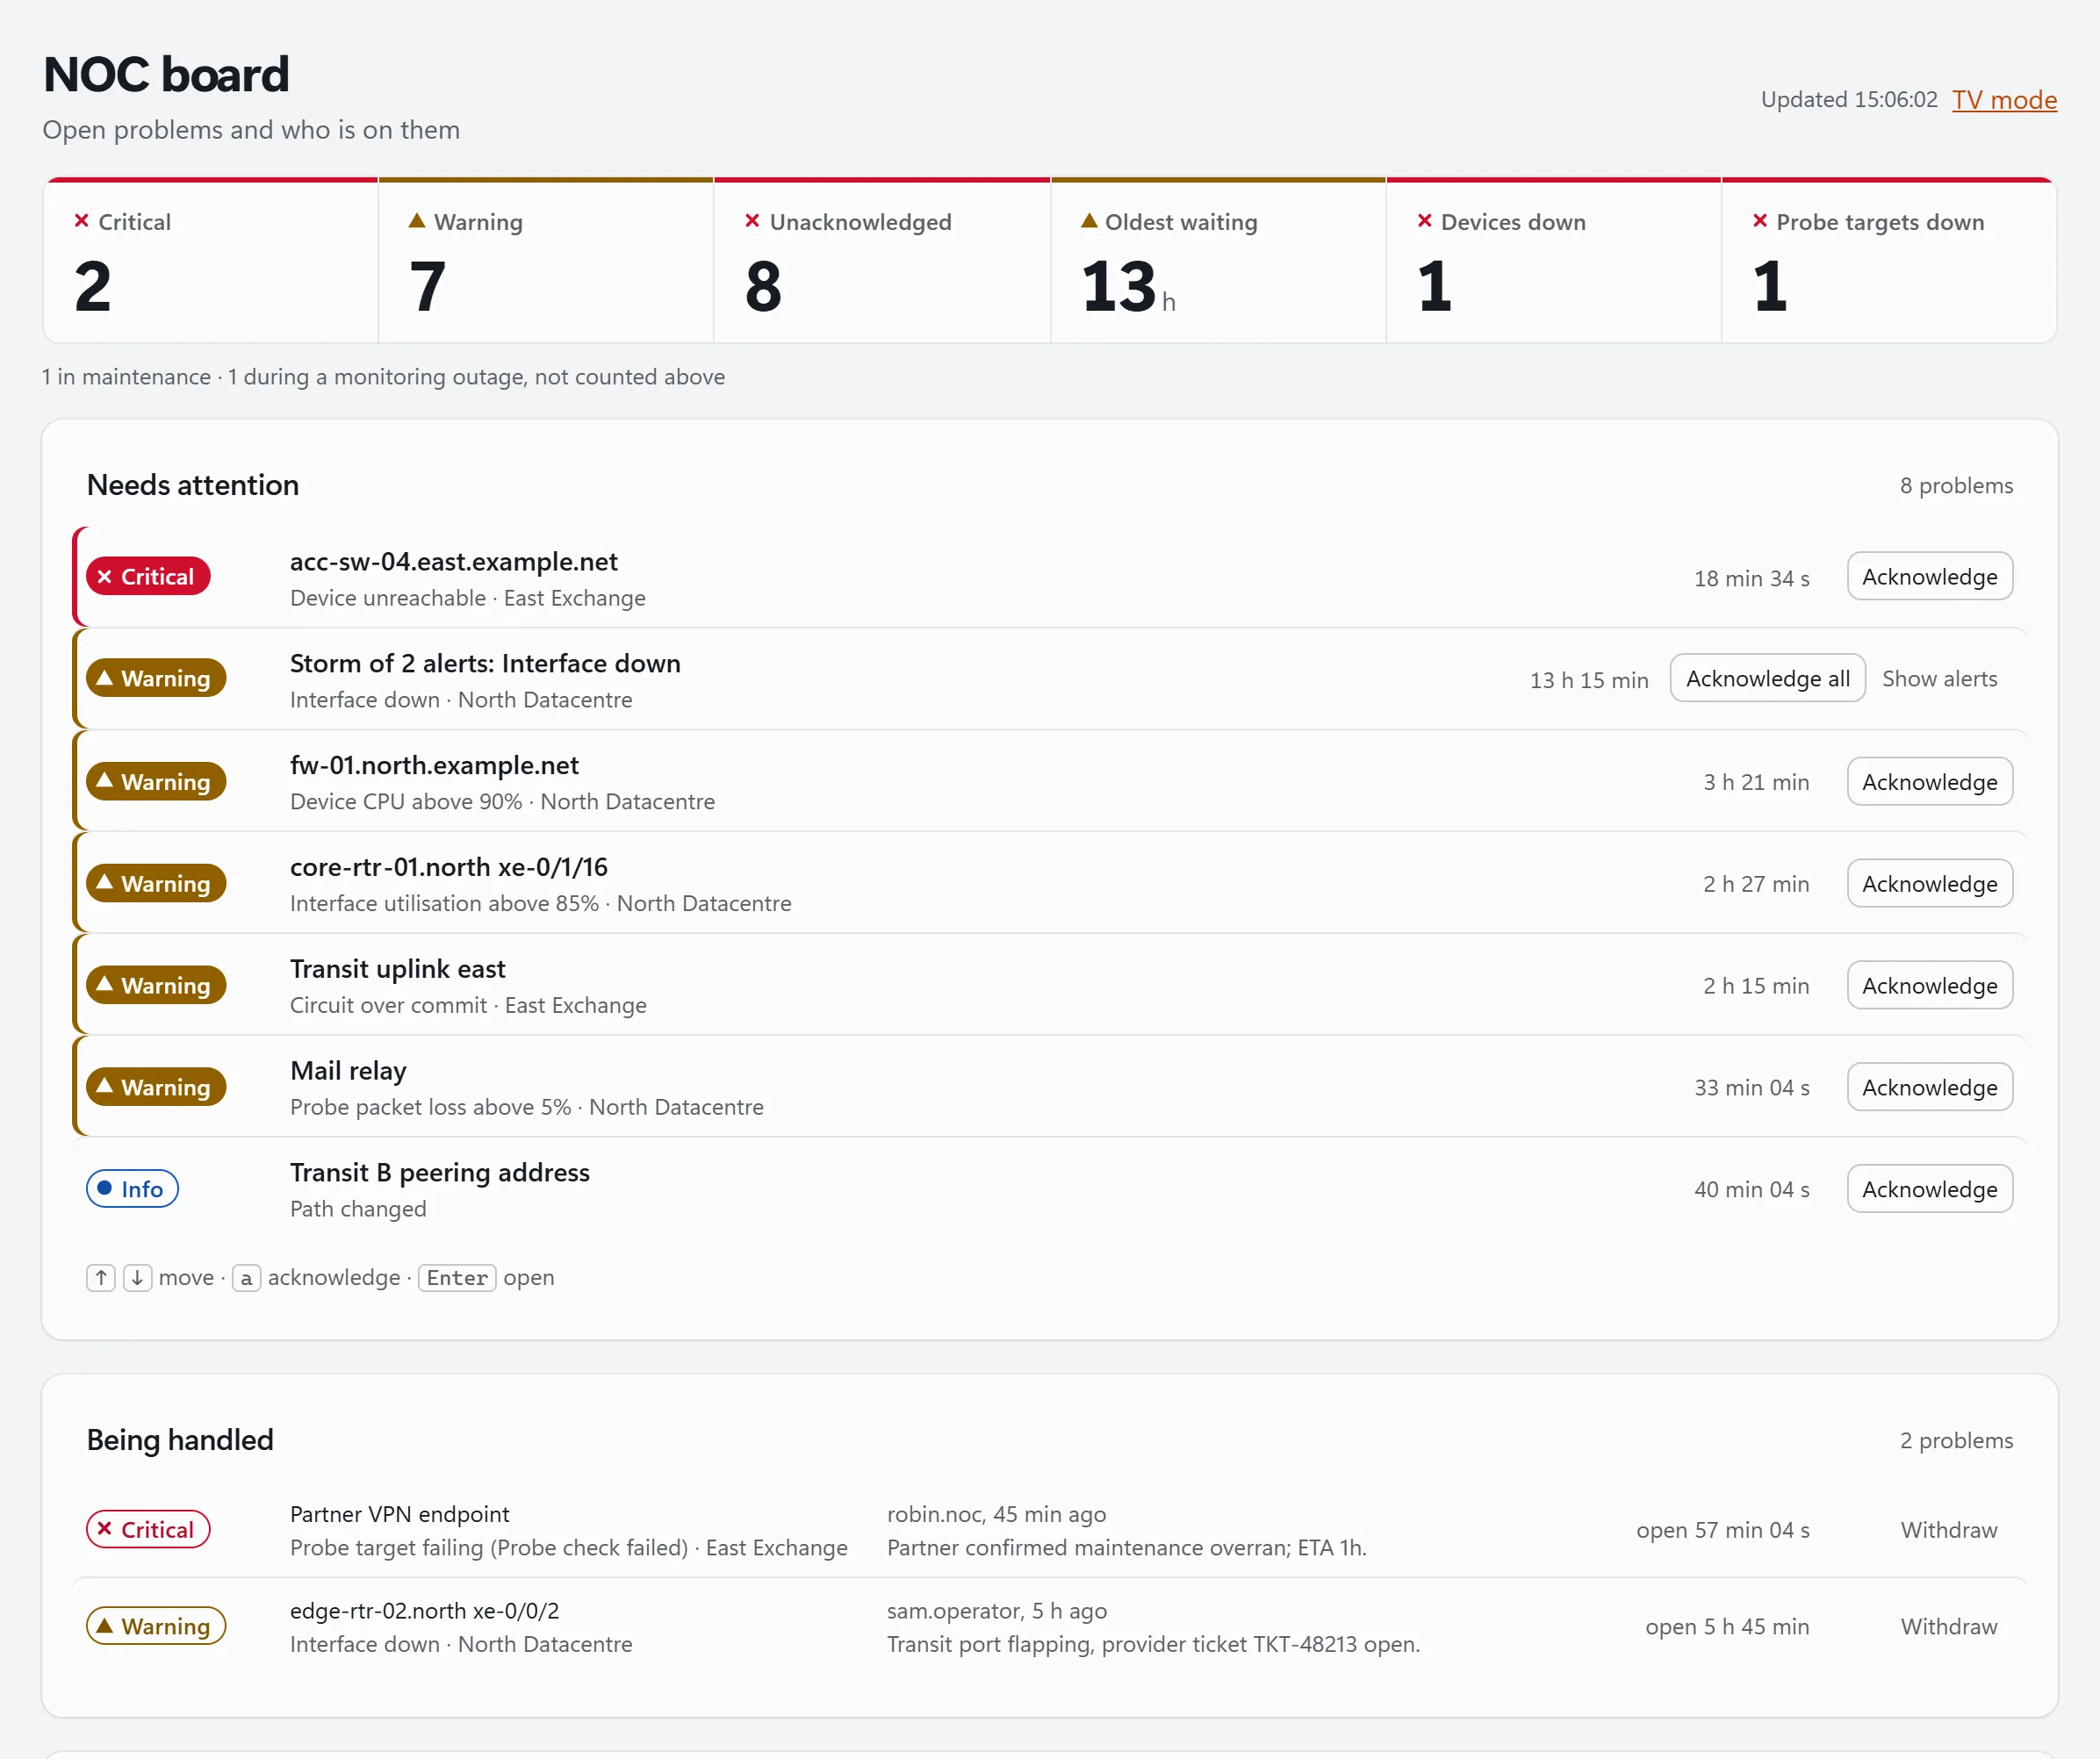
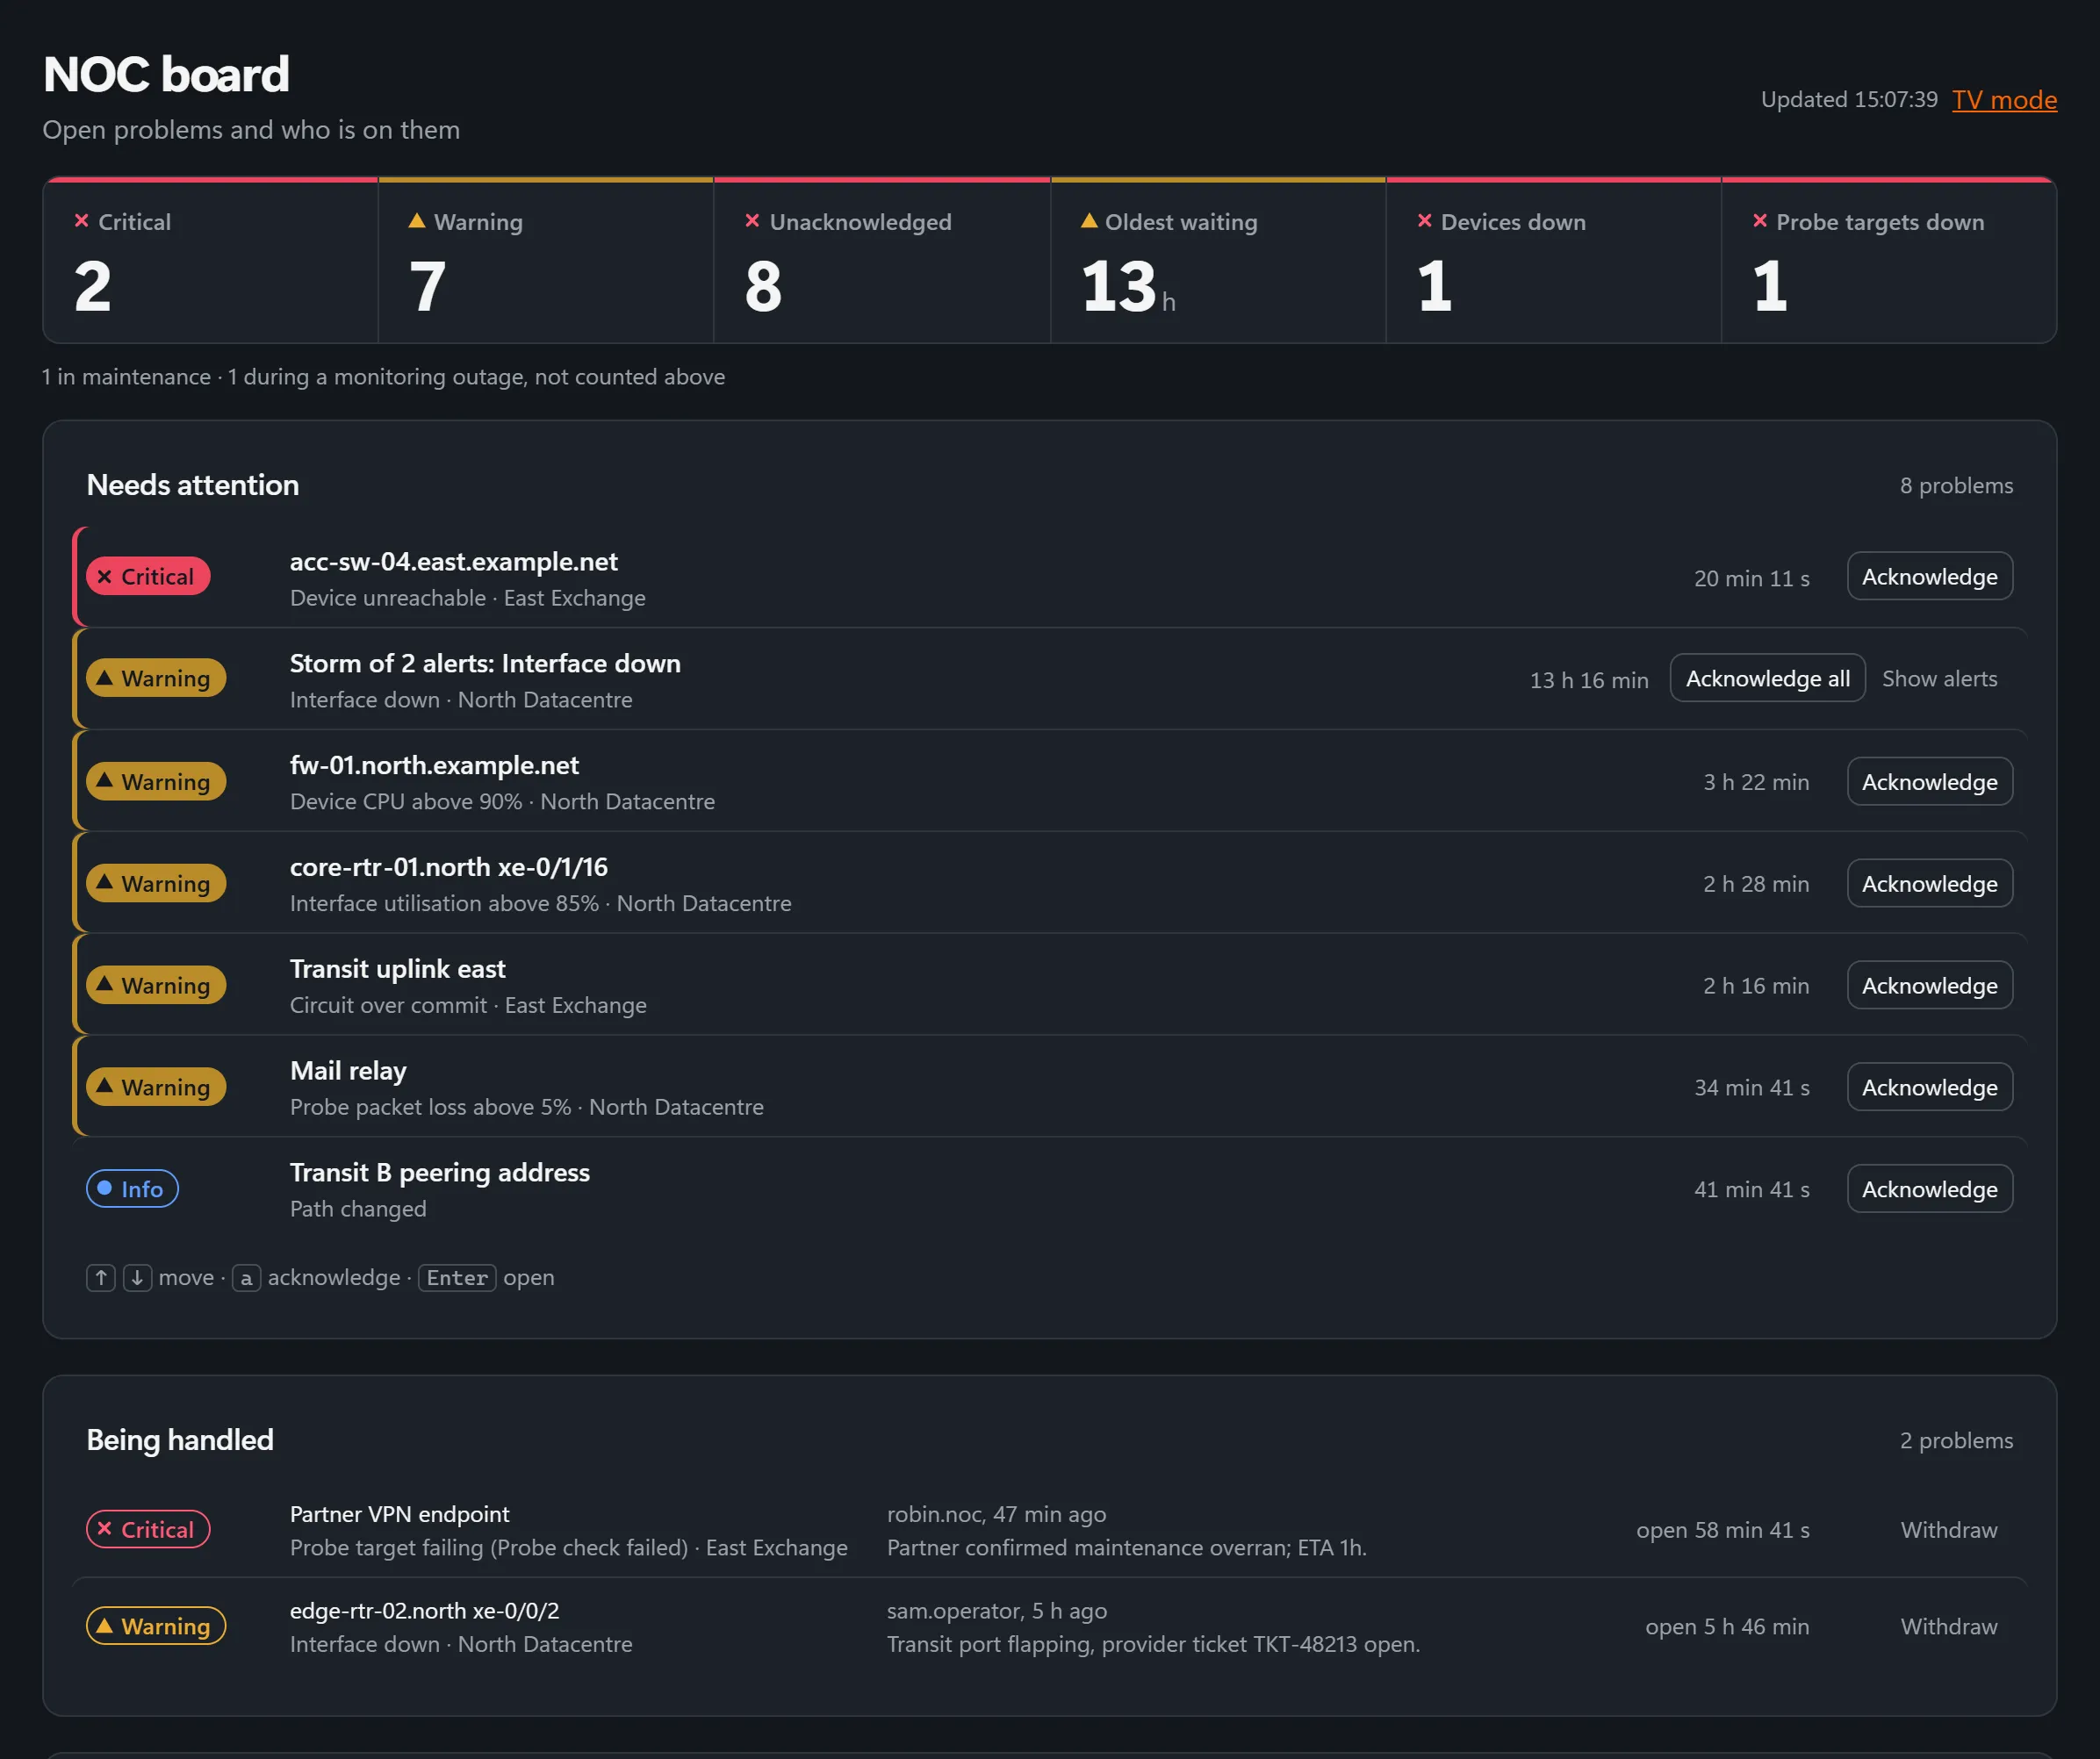
The NOC board: eight open problems, most severe first, each with an Acknowledge button, including a storm of two interface-down alerts shown as one row with Acknowledge all. Two acknowledged problems sit under Being handled, with who took them.The NOC board: eight open problems, most severe first, each with an Acknowledge button, including a storm of two interface-down alerts shown as one row with Acknowledge all. Two acknowledged problems sit under Being handled, with who took them.
Every open problem, most severe first. A storm is one row, and acknowledged problems show who is on them. Demo network.

What FishEye shows

  • A NOC board of open problems, most severe first. Acknowledge one, or a whole storm at once, and comment; who did what and when is kept.
  • A storm shown as one row: by default, 5 or more alerts of one kind within 5 minutes.
  • A TV mode for the screen on the wall, and wall screens that open with a read-only token of their own.
  • Alerts to Telegram, email or a signed webhook. A recovery goes to the same channels as its problem, and one slow channel never holds up the others.
  • Maintenance windows, one-off or weekly, that record alerts without notifying. If a problem is still open when the window ends, it is announced once.

What you do next

  • Acknowledge so the team knows someone is on it, and leave a comment for the next shift.
  • Plan the change in a maintenance window, so the team is not paged for work you announced.

Customers · Reports

Did we keep the promise?

Did we deliver the uptime we promised? An SLA (service level agreement) report answers it per customer and service, built from the runs of up and down time in every check, not from samples.

What FishEye shows

  • Monthly availability for each service, around the clock and within business hours, with South African public holidays built in and your own dates added.
  • Maintenance and unmeasured time left out of the sum, so a silent probe never counts as hours of uptime. A month with less than a day measured is never called a breach.
  • A PDF with charts, as well as HTML and CSV.

What you do next

  • Open a customer’s month and see the availability against its target, and the outages behind it.

Bring us your hardest outage.

Tell us how your NOC works today, and we will show you where FishEye fits.

Talk to us